Topographic profile
Terms
Topography is the study of geographical features on a landscape.
Topographic map is the map represent the 3D landscape of Earth within the 2D space of a map, use a colors, shading, & contour lines to represent changes in elevation, & shape
Cartographers map makers
each contour line represents an equal point of elevation, then any change in elevation would lead to inconsistent line spacing
Several contour lines spaced close together would indicate steep terrain, & lines spaced far apart would indicate gentler slope
Contour intervals the change in elevation between any two contour lines
3 kinds of contour lines
index line (I) thickest, labeled with number
Intermediate (Ln) thinner, more common, lines between the index lines, usually don’t have a number label, 1I = 5Ln
supplementary appear as dotted lines, indicating flatter terrain
Topographic Features
Peak Ring The innermost ring at the center of contour loops, represents highest elevation, & Sometimes the peak will be represented with a small X & number denoting elevation
Depression Ring an inner ring indicates a lowest elevation, which the map will show with a series of small tick marks pointing toward the center called hachures
Cliff 2 or more lines converge until they appear as a single line.
Valley (draws) When contour lines cross a valley or a stream, they make a sharp pointed V or U-shape. Rivers will run through the center of the V-shape. Sometimes called
Ridgeline like an elongated peak, not coming to a fine point. Instead of a closed inner circle, a ridgeline can look like a big oval
Saddle low lying area between 2 higher points of elevation. They appear as hourglass shapes between 2 concentric circles
Ledge Ledges or flat areas on the side of a mountain appear as protruding U-shapes that point away from the peak
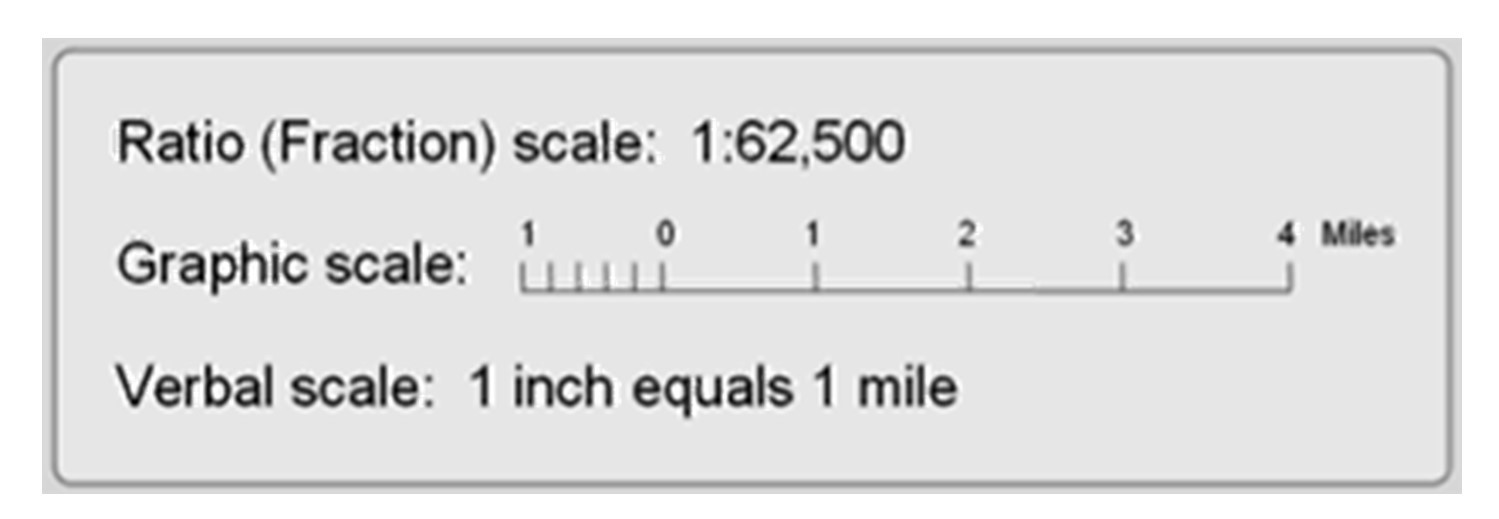
Map Scales
The scale of a map is the ratio of a distance on the map to the corresponding distance on the ground
ratio scale represented as a fraction or ratio
– for example 1:100 means one unit X on a map represents 100X on the surface
– Ex. 1:200: 1cm on map = 200cm true
Graphic scale or bar scale
– is usually printed in the lower margin of Topographic maps
– bar acts as a ruler for measuring distances
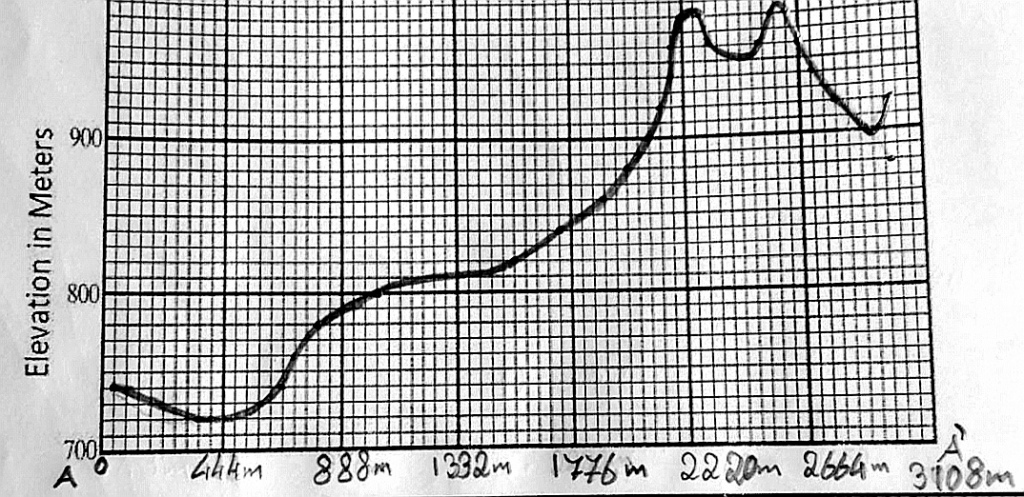
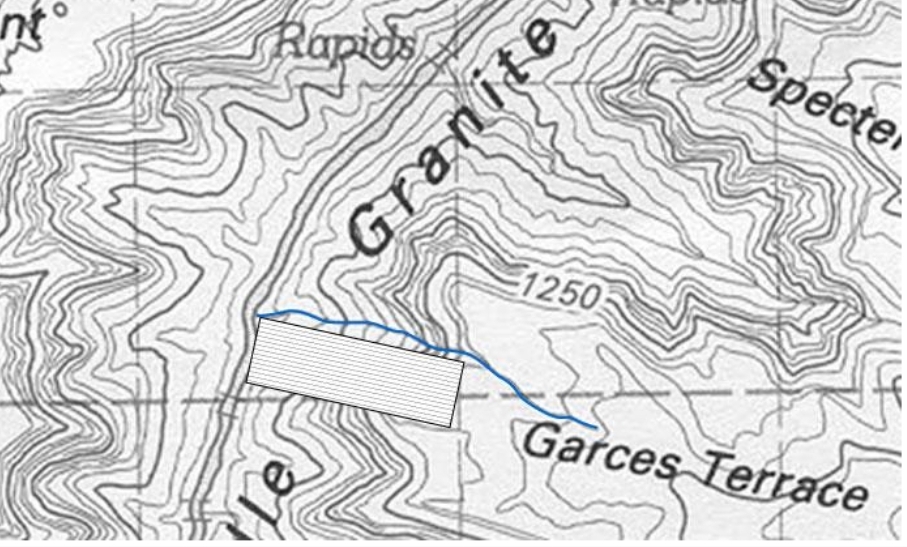
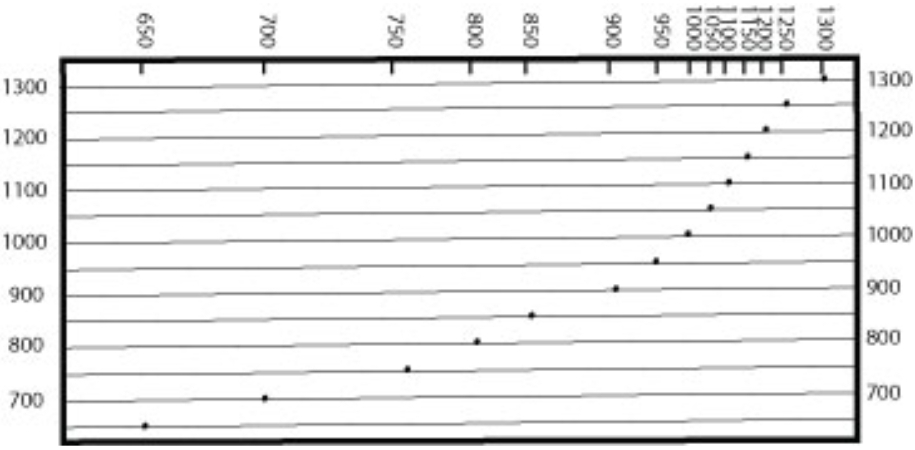
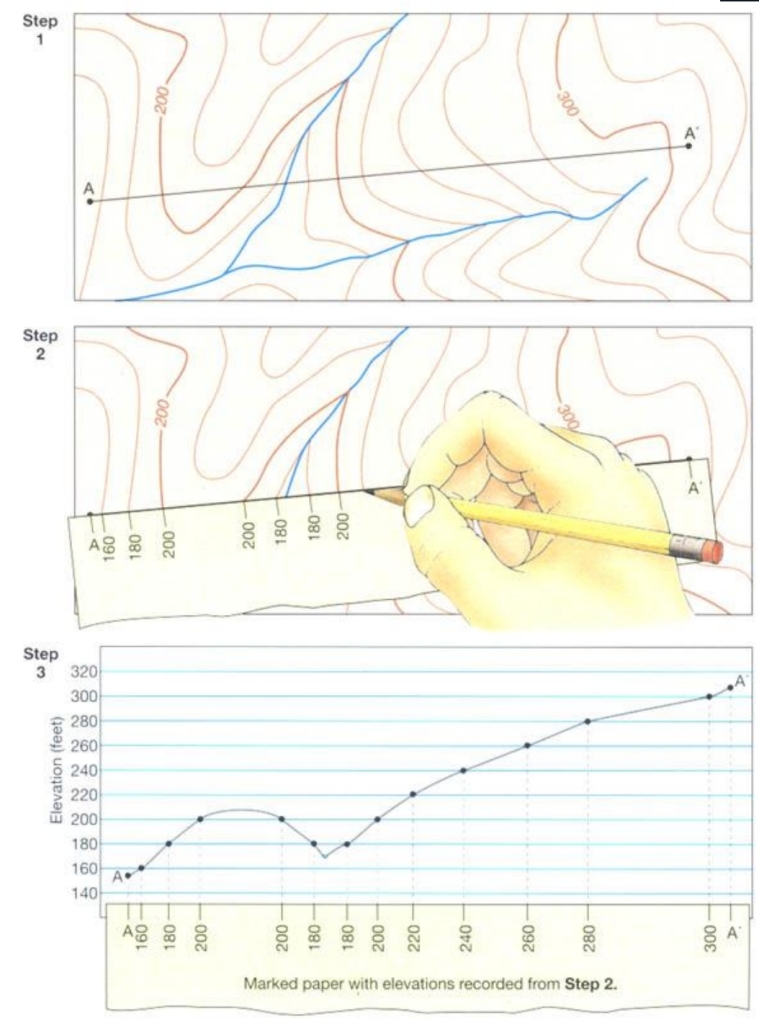
Generating profiles
Draw a line between the 2 points bounding the desired profile area
Place a folded sheet of paper along the line
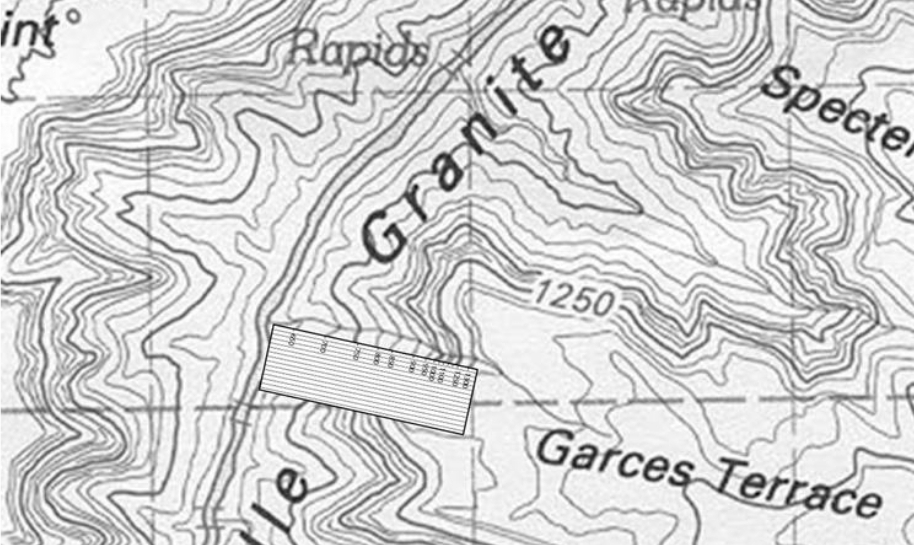
Mark each contour line intersecting the paper
Indicate the vertical height with a dot on a scale
Connect the height dots with a smooth line


Examples

Exercises
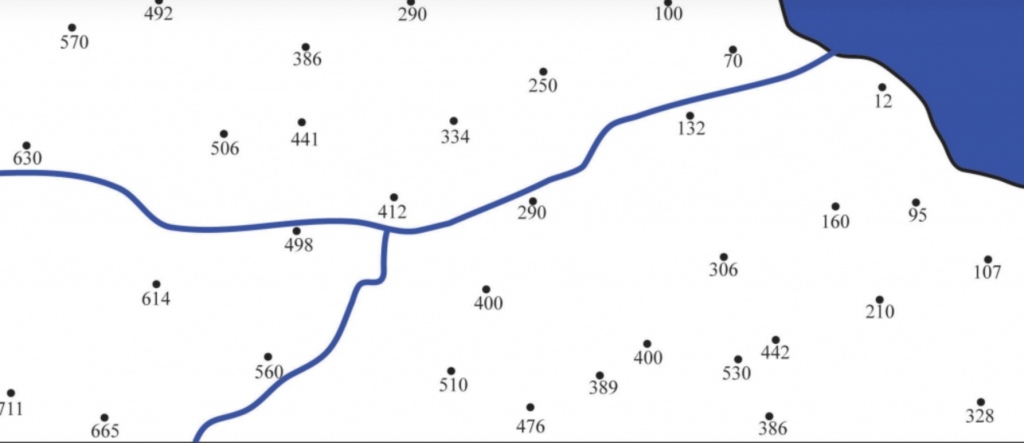
1. The river flow in ____ Direction
2. The Sea location ______

What is the elevation of points (A, B, C, D, E)
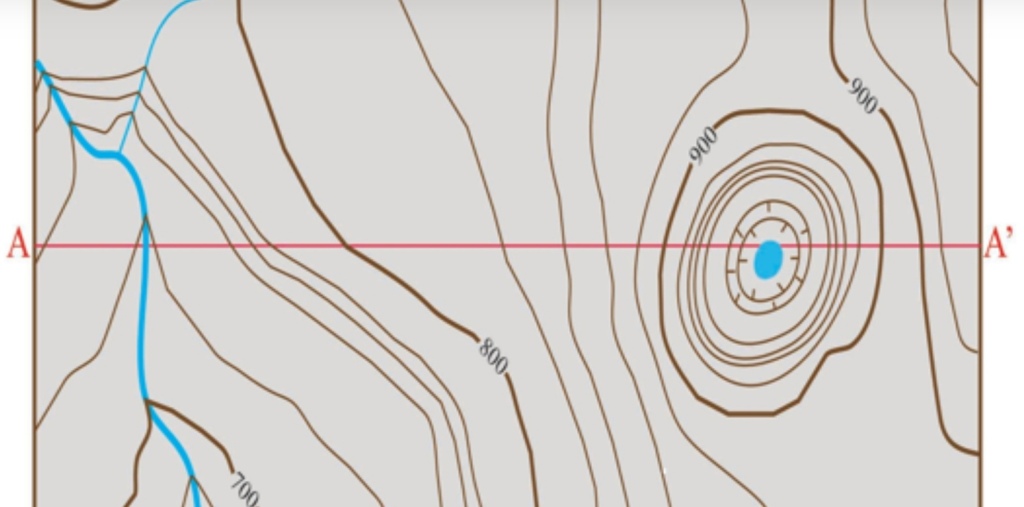
Draw the topographic profile
Solutions
Worksheet 1
1. South West to North East (SW → NE)
2. North east (NE)
Worksheet 2
1.4cm → 250m
1cm → 178.6m
A = 750m + (0.3cm*178.6m/cm) = 804m
B = 500m + (0.7cm*178.6m/cm) = 625m
C = 500 + (0.4cm*178.6m/cm) = 571m
D = 250 + (0.4cm*178.6m/cm) = 321m
E = 250 – (0.4cm*178.6m/cm) = 179m