All posts by shaashamdan

Graduation Projects

Geochemistry & Petrology
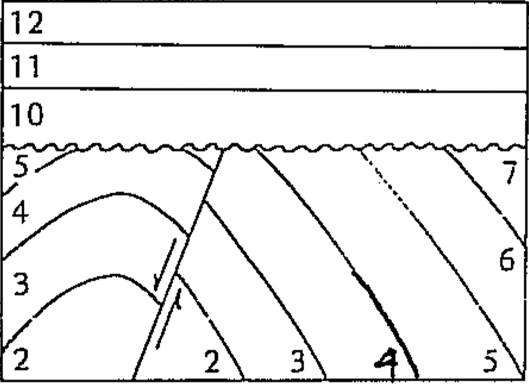
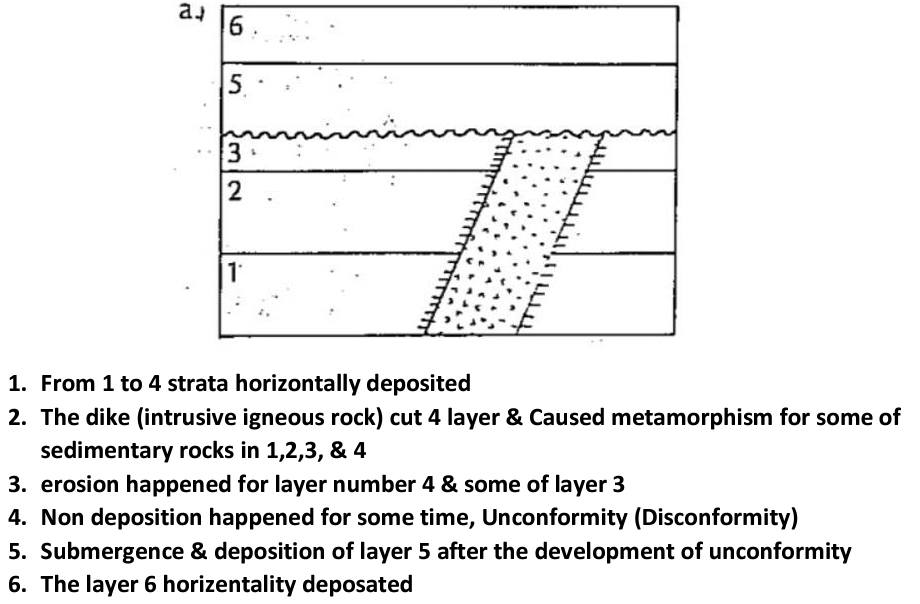
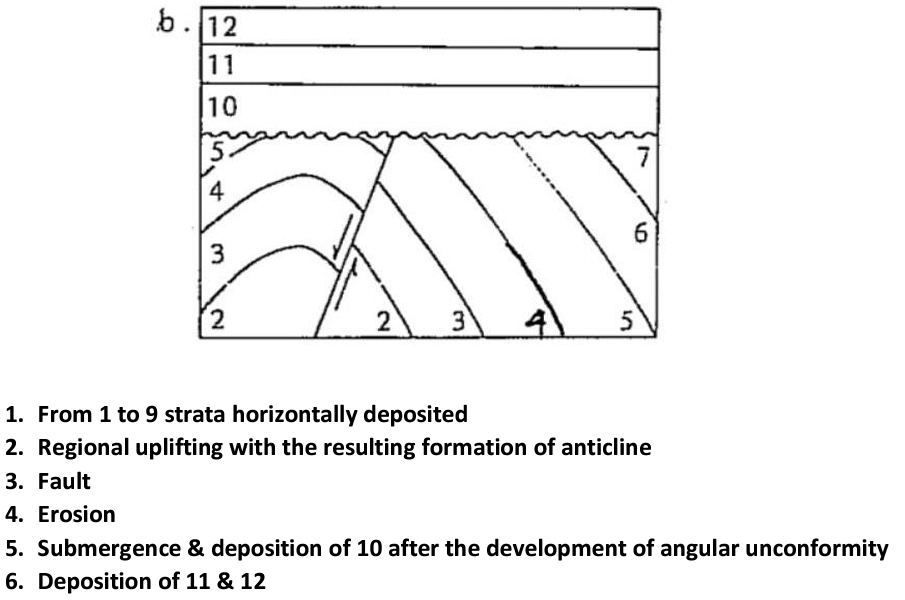
Dr. Najel Yaseen

Bayan Alorani, Besan Alshareef and Ola Almasri (2022): Petrography and Geochemistry of Turban Mafic rock, SW Jordan

Istiqlal Odeh (2022): Upgrading of Alkali Feldspar of Humrat and Wadi-Feinan using Magnetic Separation Method

Juman Abu-Touq & Sajeda Al-Rabaya (2023): Petrography and Geochemistry of Thour Mafic Rocks at Al-Quweira Area, SW Jordan

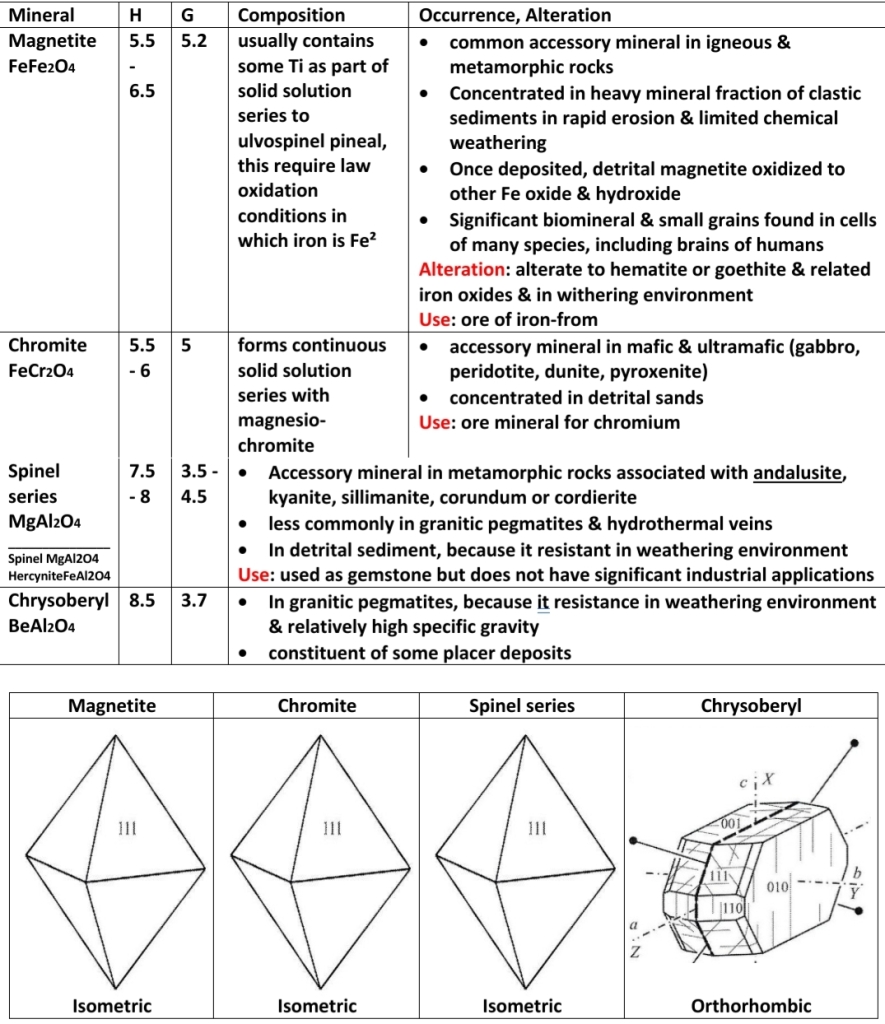
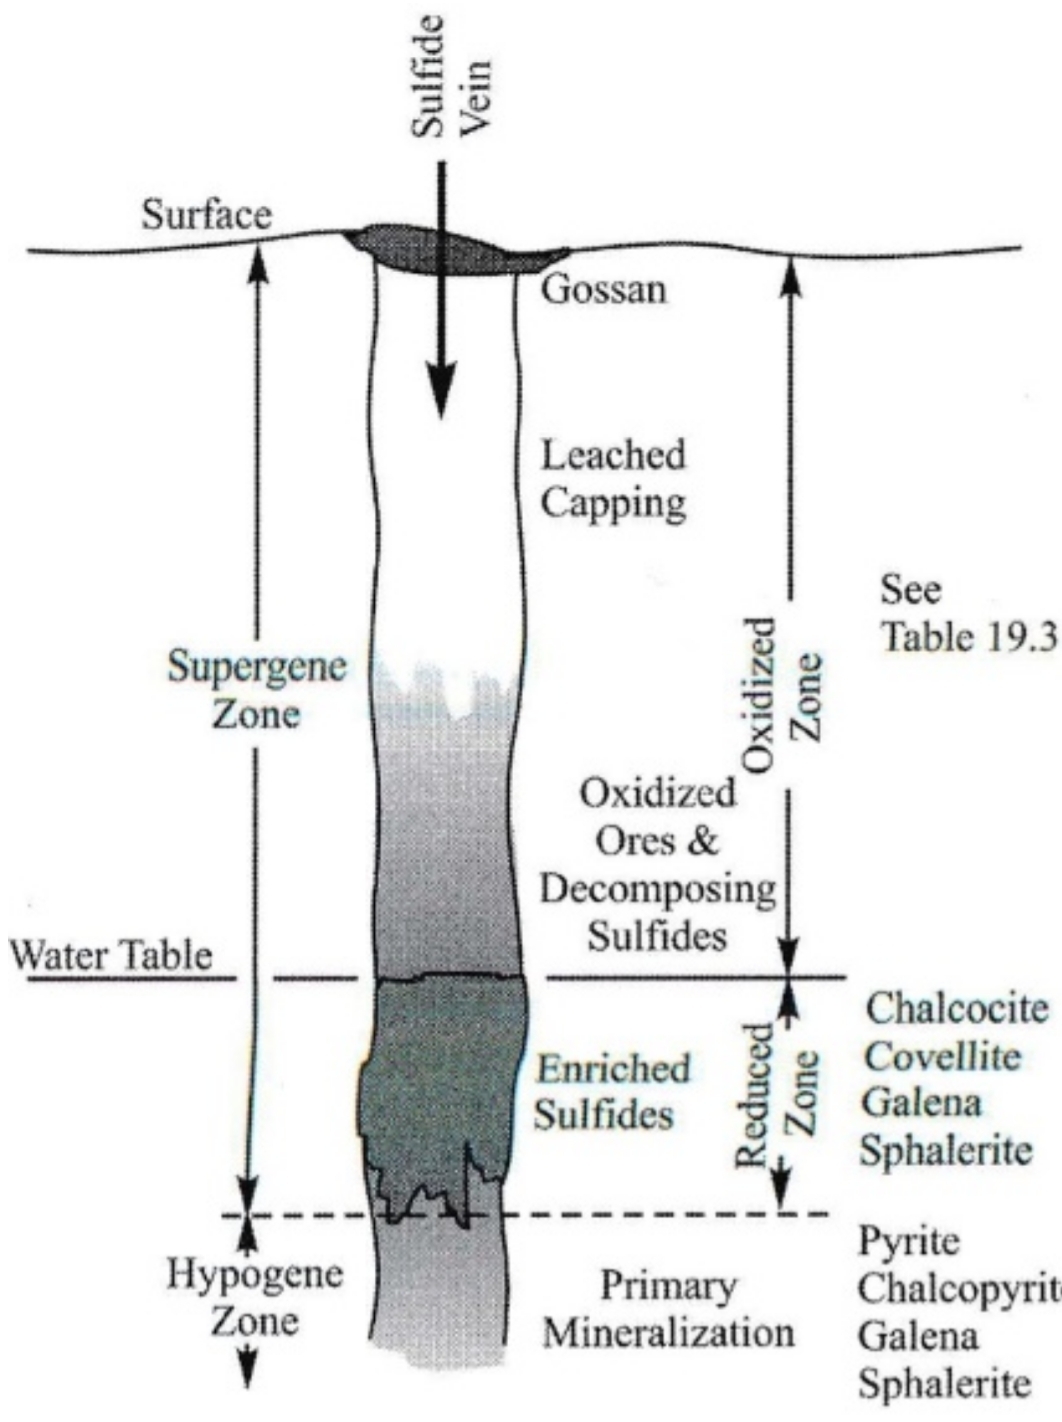
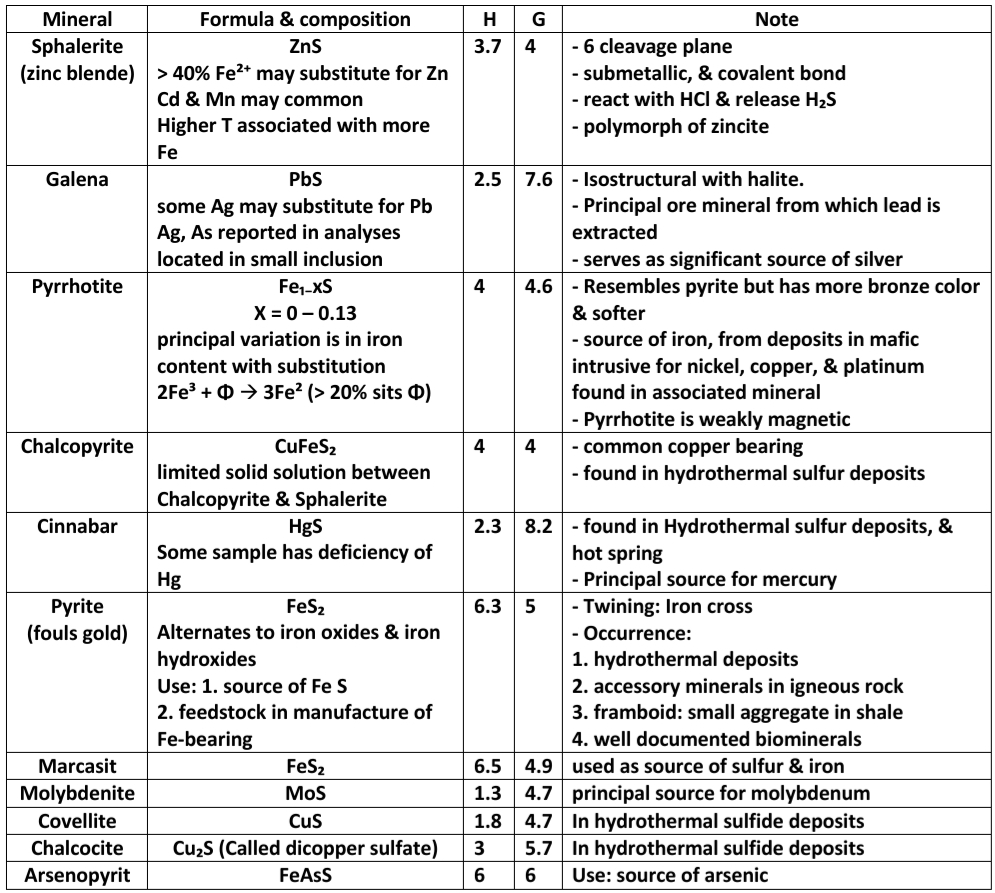
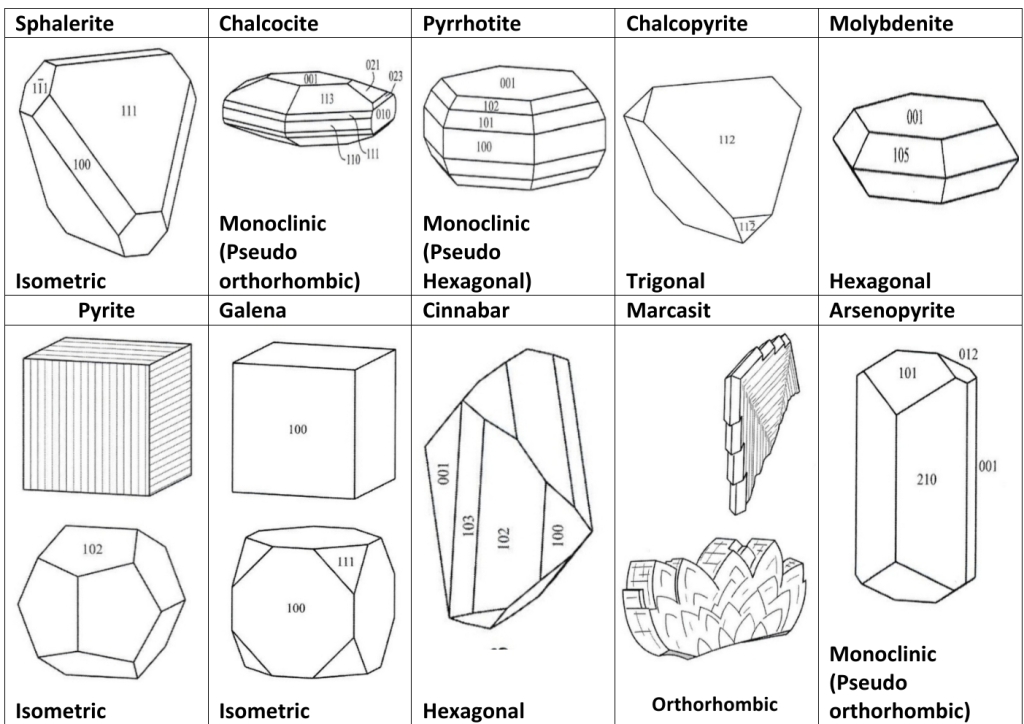
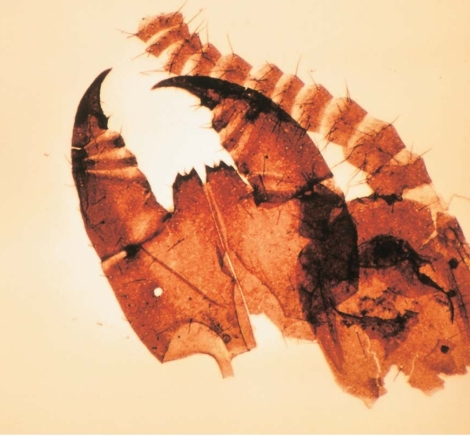
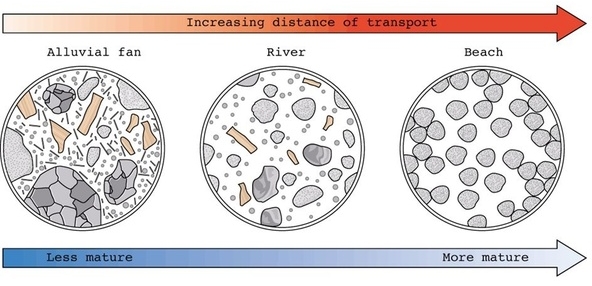
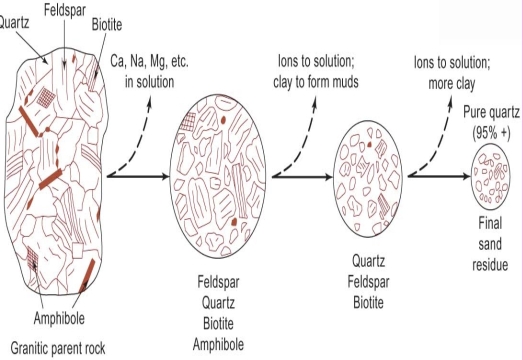
Sara Khalil Al-Haj (2023): Heavy mineral content in Dubaydib sandstone formation

Shaas N Hamdan (2022): Petrology, Petrography, Petrogenesis, Geochemistry and Geothermobarometry of Thour Diorite Unit — Al-Quweira Area / Southern Jordan

Hydrogeology & Climate

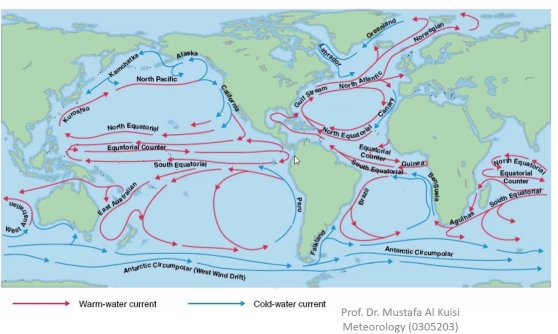
Prof.Dr. Mustafa Al Kuisi

Aisha Al-Shaikh, Sarah Hamasha, Reham Al-Khatib (2023): Water Quality Variations and Hydrochemical Characteristics of Groundwater in Dhuleil Area

Anas Hamdan, Mohammad Mahsere & Mohammad Abulawi (2023): Assessment of Groundwater Vulnerability using COP Model and GIS for Greater Amman area

Bayan Halima & Reem Al-Toukhi (2023): Air Quality index for Amman, Irbid, and Zarqa Cities

Saja Alwahsh & Fairouz Al-Salti (2023): Urbanization Impacts on Flood Risks based on Land Cover Devlopments in Amman

Siham Jaber & Abeer Alhalaby (2023): Groundwater Vulnerability Mapping & Risk Assessment for the susceptibility of groundwater resources to contamination for Greater Amman Area by using DRASTIC method

Environmental Resource

Dr. Khitam Al-Zghol

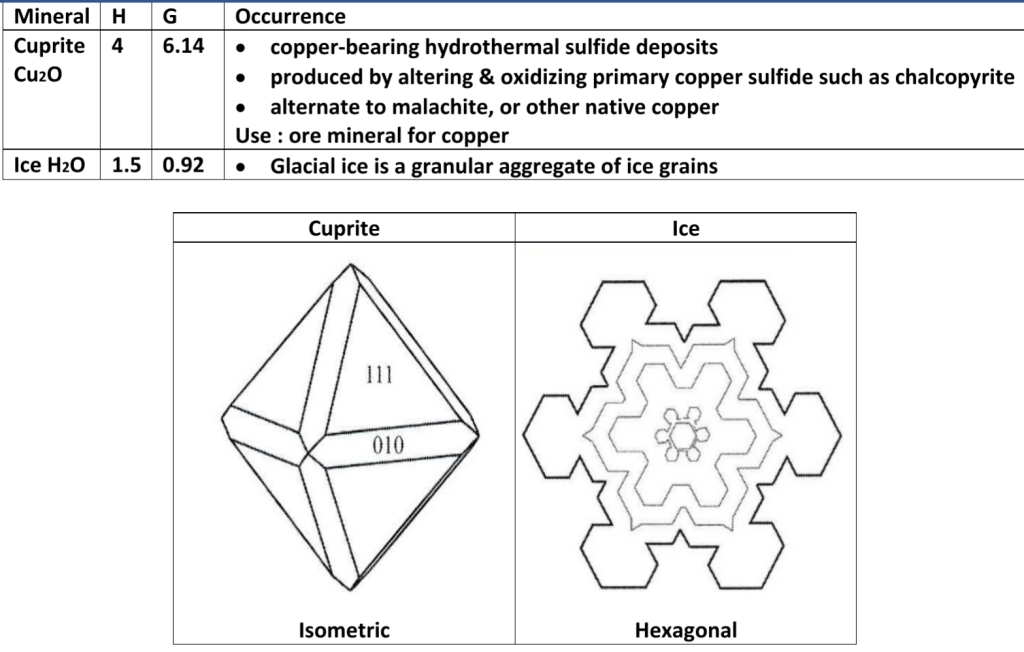
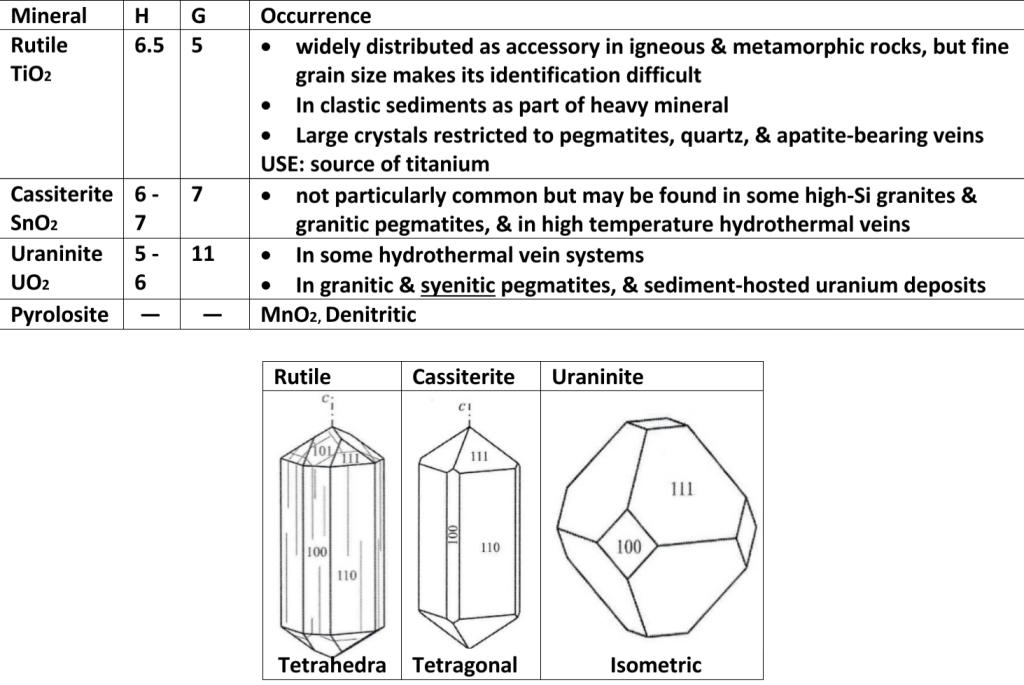
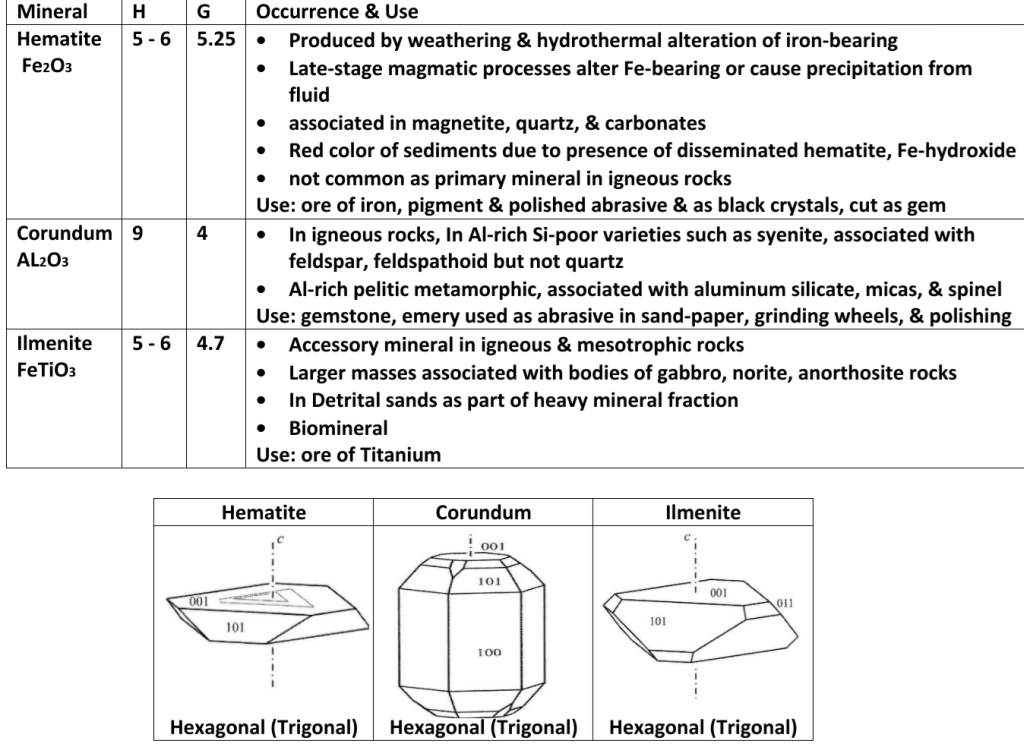
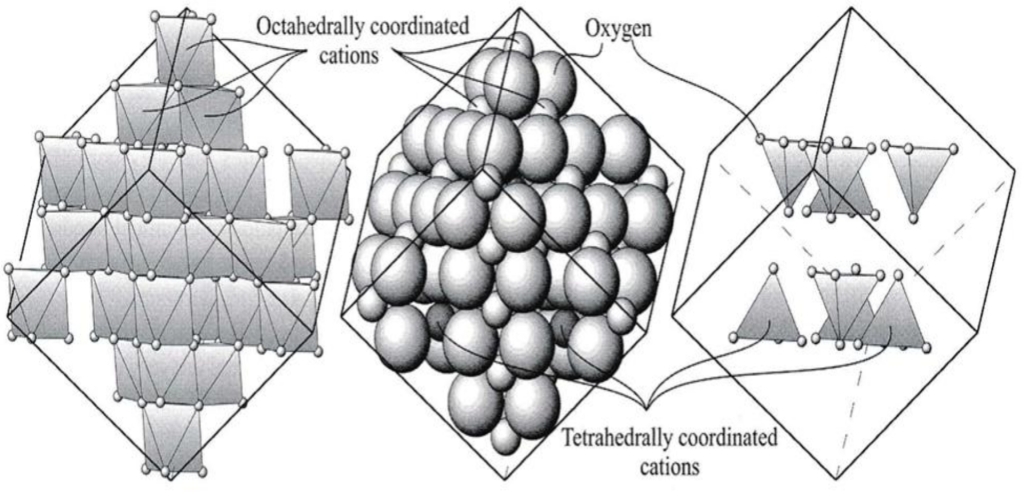
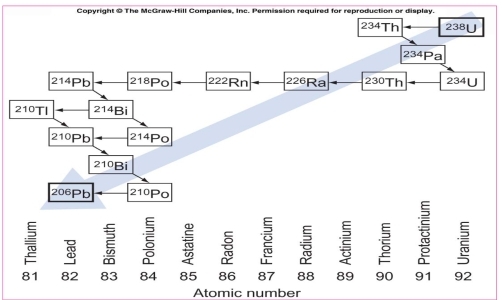
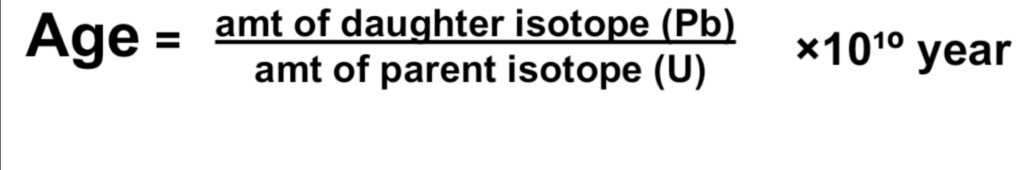
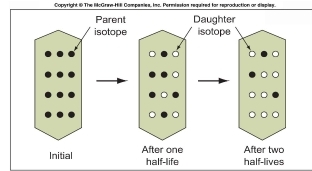
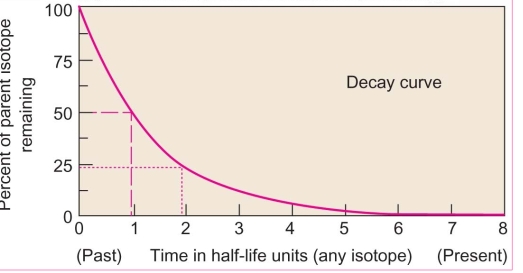
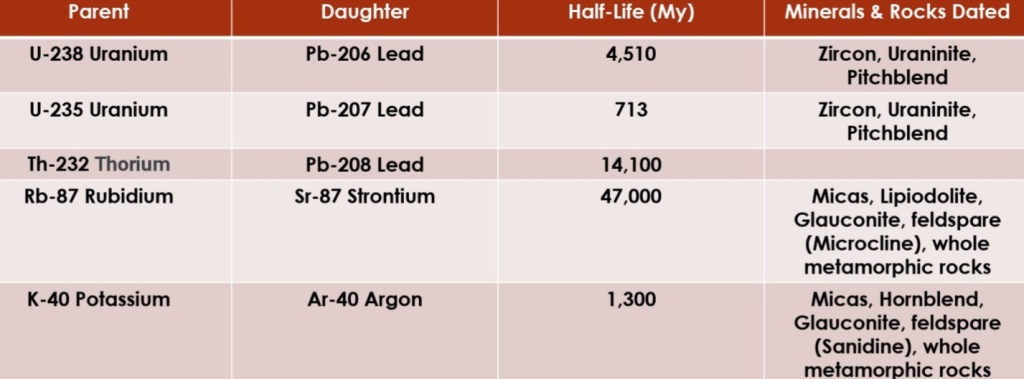
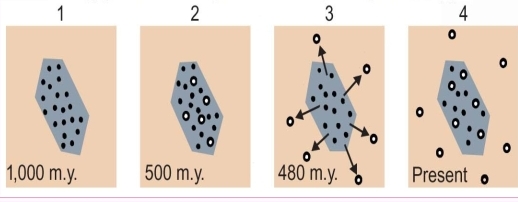
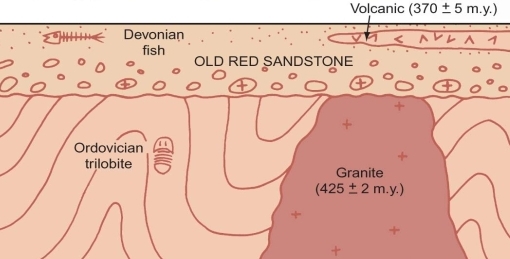
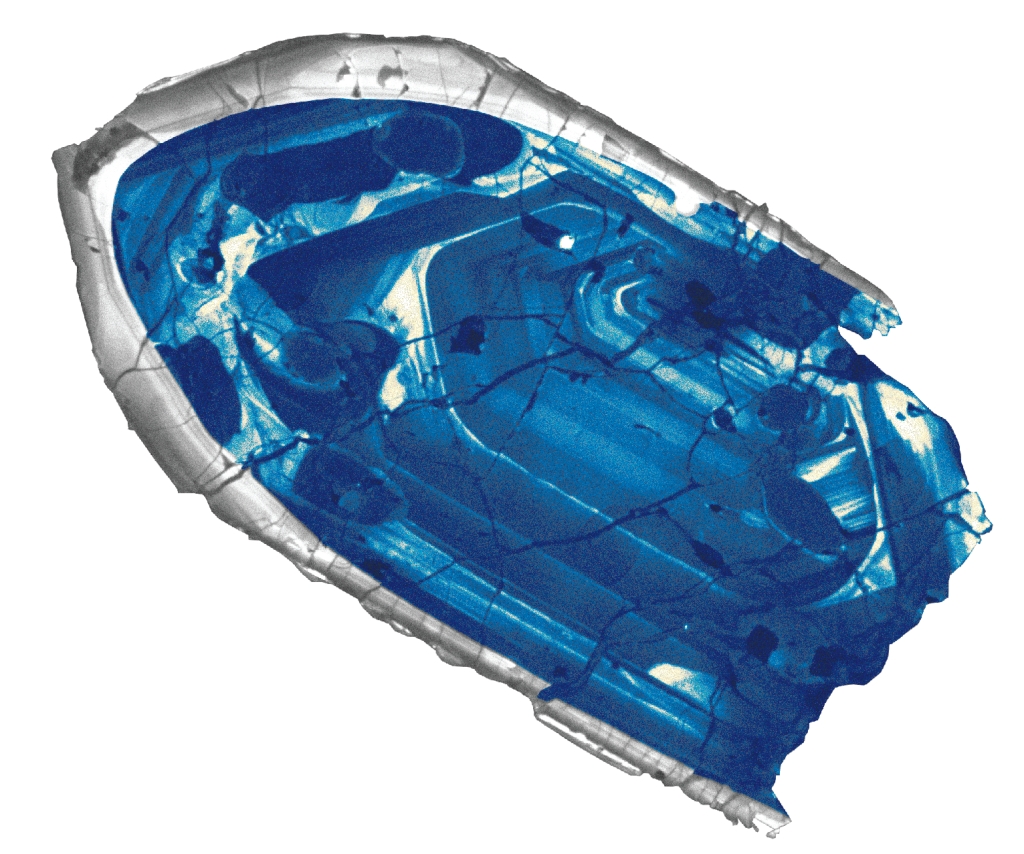
Alaa Afaneh, Hala Sheqwara & Lamees Baker (2023): Geological Characterization of Uranium Minerals Deposits in Central Jordan
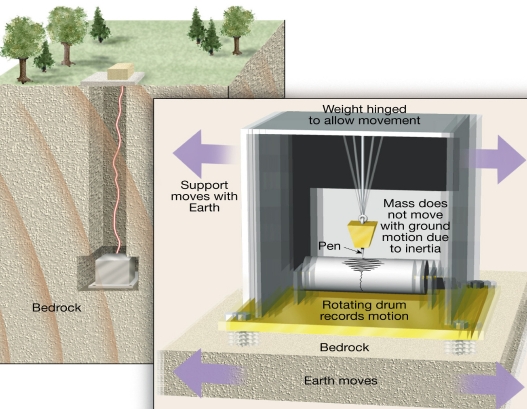
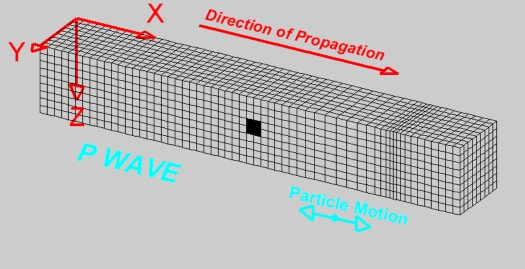
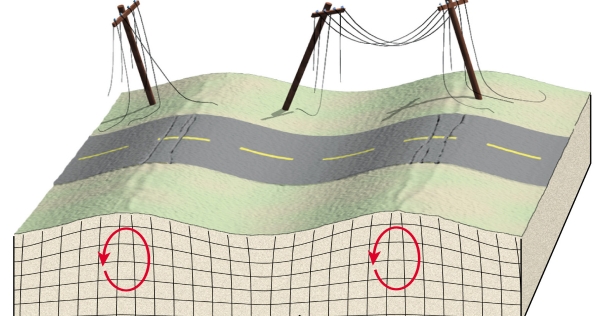
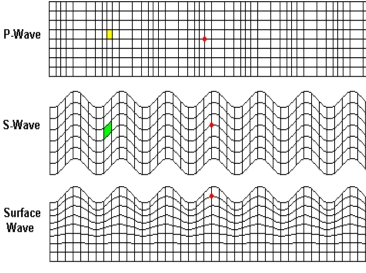
Geophysics

Dr. Mu’ayyad Al Hseinat

Alaa Al khlaifat & Dania Salameh (2023): Examining the Deformational Style of the Karak Wadi Al-Fayha Fault Zone within the Al-Jafr Region

Rand Al-Bdoor & Reema Al-Dhoon (2023): Seismic Reflection Investigation of Al-Sirhan Development Area,  southeastern Jordan

Reham Ibrahim & Batool Alazzeh (2023): Examining the thickness of Upper Cretaceous deposits in selective places in Jordan (Jafr, Sirhan, Hamza exploration areas)

Geoarchaeology & Geotourism

Dr. Ahmad Smadi

Iman Mohammad, Ayat Wael & Mais Al-sheikh (2022): Geoarchaeology – Geotourism (Umm Qais Site)“Columns & El-Cardo” (Main Street)

مشروع التخرج هو تدريب على البحث العلمي او بحث علمي يقوم به الطالب في احد فصول التخرج حيث يقوم بتحديد فكرة بحث او مشروع وبكثير من الاحيان اقتباس الفكرة من احد دكاترة واساتذة القسم ثم يقوم بتطبيق معرفته الجيولوجية وربطها في معارف اخرى اذا لزم الامر بوسطة العمل الميداني والمخبري للوصول الى نتائج تتفق مع اهداف فكرته البحثية ثم تفسيرها ثم كتابة تقرير في الدراسة التي قام بها (وهذا الجزء هو المنشور في هذه الصفحة بهدف الاطلاع على تجارب الطلبة السابقين للتعلم منها بكيفية الكتابة العلمية بعد تعديل الدكاترة الاخير)

ملاحظات ونصائح من اخطاء متكررة

* معظم التقارير في هذه الصفحة تنسيقها تالف لكن تسلسلها جيد (حتى الان).
* اذا كان لديك فكرة لبحث ما يفضل ان تبادر بها وان تعمل على تطبيقها عوضاً عن الاعتماد على الدكاترة بالفكرة.
* يتوجب مراعاة اهتمامك في اختيار اي ميدان تريد العمل به، فمثلا اذا كنت تميل للجيوكيمياء عليك اختيار احد الدكاترة المختصين بالجيوكيمياء وموضوع مختص بالصخور والجيوكيمياء وغير ذلك سيصبح ارهاق شديد عليك وضغط نفسي لا يحتمل.
* يمكن القيام ببحث التخرج بمفردك ويمكن القيام به بمجموعات كحد اقصى 4 طلاب، يجب ان تتفقوا مع بعضكم البعض قبل قبول العمل مع بعضكم البعض.
* عندما تذهب الى دكتور ليعطيك فكرة لتعمل عليها ويشرح لك جزء منها استمع له جيدا، وعند خروجك من مكتبه ابحث عن الشيء الذي قاله لك وتأكد انه من ضمن اهتمامك ولا تقبل الفكرة الا اذا كنت تفهم شرح الدكتور لها وانها تناسب قدراتك وفهمك للتخصص لتجنب الضغط النفسي.
* اثناء اجراء خطوات البحث بالعمل الميداني او المخبري سجل كل شيء مباشرة على هاتفك او على دفتر صغير، ادق الملاحظات ولا تترك كل شيء لوقت كتابة التقرير لانك لن تعلم حينها ما الذي فعلته وكيف ستبدأ بالكتابة.
* اثناء الكتابة، اي معلومة تحصل عليها من اي مصدر اياك ان تنقل المعلومة وتترك مصدرها بل انقل المعلومة وانقل المصدر الذي تحصلت به على المعلومة وغير ذلك سيصبح توثيق ما كتبته عملية معقدة جدا وغالبا لن تستطيع القيام بها بمفردك بل تحتاج مساعدة دكتور او مكتبة او احد الـ “نيردات” الملمين جدا في المجال الذي تبحث به، لذا تجنب هذا الامر.

كتاب الكتابة العلمية لغير الناطقين باللغة الانجليزية:
Science Research Writing for Non-native speakers of English

Stratigraphy & Historical Geology

Stratigraphy & Historical Geology

Course Materials

Geologic Time & Earth History

Stratigraphy & Historical Geology

The Numerical Dating of the Earth

The Origin & Early Evolution of the earth

Mountain Building & Drifting Continents

Cryptozoic History

Early Life & Its Patterns

Earliest Paleozoic History

The Later Ordovician

The Middle Paleozoic

Late Paleozoic History

The Mesozoic Era

Lab Materials

Lab 1 : Topographic Maps

Lab 2 : Topographic Profile

Lab 3 : Topographic Profile II

Lab 4 : Geologic Cross-Section

Lab 5 : Inclined Strata

Lab 6 : Geologic Time

Lab 7 : Geologic Time II

YouTube

Topographic Profile & Geologic Cross Section (On YouTube)

Inclined Strata

Biology 101

فيديوهات شرح النادي الطبي

ملخص شأس حمدان لمادة الفيرست

ملخص شأس حمدان لمادة السكند

ملخص شأس حمدان لمادة الفاينل

سلايدات

ملاحظة عن تجربة شخصية: انصح بدراسة المادة عن سلايدات الدكاترة او الكتاب والتركيز مع الدكتور بالشرح وجميع ملخصات الطلاب (ومنها ملخصي) ليست سوى نقل حرفي للسلايدات اضافة ان ترجمة المادة اثره سلبي على الطلاب لانه يسبب صدمة في الامتحان وبوجهة نظري ان سبب فشل الطلاب بهذه المادة هو الدراسة عن ملخصات مترجمة كانت هذه المادة من اسهل المواد التي تقدمت اليها ولم ادرس الا على السلايدات (ملخصي الذي لا يعتبر سوى نقل للسلايدات)

امتحانات التعليم الاضافي وامتحانات ديوان الخدمة المدنية

امتحانات التعليم الاضافي وديوان الخدمة المدنية حتى 2022

نموذج للتعليم الاضافي للعام 2021

Paleontology & Body Fossils

Chapter One

Paleontology

Paleontology: is the study of the history of the life on Earth as based on fossils (age, formation, & evolutionary)

Fossils: any preserved remains, impression, or trace of any living thing from a past
– are the key of understanding of past life
– give clues about organisms lived ago
– help to show that evolution has occurred
– provide evidence about how Earth’s surface was changed over time

Age of fossils: youngest from Holocene to the oldest from archaean (> 4.48Ga)
– Age of earth 4.6Ga, & the oldest fossils 3.5Ga
– most fossils are found in sedimentary rocks
– the oldest known fossils are cyanobacteria that produced structure called Stromatolites

The ancient atmosphere consists of CO, CO₂, H₂O, N₂, H₂, NH₃, CH₄, H₂S, & little free O₂
Table 1:1 Types of True Fossils
Table 1:2 Hard parts of fossils (common mineral components)
Table 1:3 The process of fossilization (taphonomy)

Conditions favorable for preservation

1. Rapid & permanent burial
2. Continued sediment accumulation
3. Lack of oxygen (O limits decay & scavenging)
4. Lack of heat or compression (destroy fossils)
5. Hard body parts (skeletal bones, exoskeletons)
Table 1:4 Formation of fossils

Body fossils

actual body or body fossils that preserved may be altered (chemically or physically)
1:5 Types of body fossils (Unaltered & altered remains)
Table 1:6 Types of unaltered remains
mammoth: Pliocene 5Ma- Holocene 4,500yr
Table 1:7 Types of altered remains
Table 1:8 Types of replacement in altered remains

Molds & Casts

Mold & cast: 3D preservation where the original is not present

As remains buried, they surrounded with sediment

Mold impression of skeletal (or skin) remains in an adjoining rock

If buried object hollow, it infilled with sediment, the actual buried object decays or dissolved, leaving internal & external mould

Casts: are formed when an external mould is infilled by sediment or precipitated minerals
– appears as replica of original buried object
– cast is original skeletal material dissolves cavity (mold) fills with materials
Table 1:9 mold types

The End

Chapter 12 : Framework Silicate

Introduction

Review

Framework silicate = Tectosilicate
Number of O shared per T = 4
Si:O ratio = 1:2
Structural configration = Framework tetrahedra

INTRODUCTION

More than two-thirds of the Earth’s crust is composed of frarnework silicate minerals, because include quartz & feldspar

The structure of all these minerals is based on aframework of TO₄ tetrahredra
– T is Si, or A1 3and each of the 4 oxygen anions is shared with another tetrahedron

Open structure lead to 2 consequences :
1. Composition: easily accommodate large cations (alkaline) due to largest coordination site (O with 6-fold & shear corner) if substitute Si by Al in T site
2. physical properties: law specific gravity (due to Occurrence, occur at law P in crust)
The common framework silicates, & occurrence in rocks
quartz, plagioclase, & alkali feldspars are most abundant

Chapter 17 : Carbonates, Sulfates, Phosphates, Tungstates, Molybdates, & Borates

anionic groups

minerals described in this chapter have structures based on anionic groups that have [-2, -5] charge

Carbonates CO₃²-
Sulfates SO₄²-
Phosphates PO₄³-
Tungstates WO₄²-
Molybdates MoO₄²-
Borates BO₃³-

Part.1 : Carbonates

CARBONATES CO₃²-

OH- groups or other anionic components may be present

Common carbonate minerals divided into:
1. Calcite Group: calcite, magnesite, siderite, rhodochrosite, & smithsonite
2. Dolomite: dolomite, ankerit, kutnohorit
3. Aragonite Group: aragonite, witherite, strontianite, & cerussite
4. OH-Bearing Group: azurite, malachite

RHOMBOHEDRAL CARBONATES

calcite & dolomite groups share same structure & collectively called rhombohedral carbonates, because they have rhombohedral symmetry

Successive layers offset so that position of C is equivalent to cubic close packing, & repeated in every third CO₃ layer, comers of triangular CO₃ altemate by mirror plane every layer (ABC) result is exact duplicate layer of CO₃ groups is repeated only every sixth layer.

Divalent cations (Ca, Mg, Mn, & Fe) occupy octahedral (6-fold) sites, Each O coordinates with one C within its layer, one divalent cation above it, & one below

surfaces of 3 cleavage “rhomb” parallel to 3 edges of triangular carbonate groups

This discussion leads to a problem with nomenclature in rhombohedral carbonates

Solid Solutions

In calcite group: controlled by ionic radii
– between magnesite Mg, & siderite Fe, & between siderite & rhodochrosite is complete
– limited between rhodochrosite & magnesite
– Limited between Ca (1.14) & Mg, Fe, Mn
ionic radii (Mg 0.86), (Fe 0.92), (Ca 1.14), (Mn 0.96)

In dolomite group: Dolomite CaMg(CO₃), & ankerite Ca(Mg,Fe)(CO₃), form solid solution series, & some Mn may substitute for Fe or Mg
Aragonite Group
orthorhombic aragonite structure favored for cations whose radius in octahedral (> 1.1A) & calcite structure favored for smaller cations (Because Ca²⁺ anionic radius = 1.14 A in octahedral) so fit in either structure
Calcite Group

Calcite (Mineral)

Composition:
– nearly pure CaCO₃
– because Crystallization at elevated T allows for some Mg, Fe, Mn, or Zn
– Mg is common substation
– Some larger cations (Ba or Sr) may present

Form
– prismitic, Rhombohedral, scalenohedron

Iceland spar: High-quality clear calcite
Hexagonal (Rhombohedral)
Dolomite Group
Aragonite Group
Alteration in Aragonite
commonly inverts to its polymorph calcite, & pseudomorphs of calcite after aragonite are common, also may be replaced by dolomite

OH-BEARING CARBONATES

Restricted to oxidized portion of Cu-bearing hydrothermal sulfide mineral deposit

Occurrence
1. produced when primary Cu sulfide, such as chalcopyrite, oxidized & altered by acidic water percolating down from surface
2. carbonate component acquired from CO₂, dissolved in meteoric water or from carbonates in host rock for mineral deposit

Use minor ore of copper
OH-BEARING CARBONATES

Chapter 18 : Oxides, Hydroxides, & Halides

Part 1 : Oxides group

Oxides

Include compounds in which cations of one or more metals are combined with oxygen

All of these minerals, except ice, are isodesmic, so they don’t contain anionic groups

Chemical bonding is dominantly ionic
– except Ice (molecular crystal)

Most of minerals have high symmetry, reflecting fact that structures based on systematic packing of oxygen in cubic or hexagonal close packing

Cations occupy tetrahedral & octahedral sites between regularly packed anions

Oxides Conveniently grouped on basis of cation to oxygen ratio
XO group
X₂O group
XO₂ group
X₂O₃ group or Hematite group
X₂O₃ GROUP or Hematite group Structure
All share a confirm on structure based on hexagonal close-packed oxygen anions, with metal cations occupy octahedral sites

Corundum Color

Blue : contains Fe & Ti
Red : contain Cr
Yellow & green : contain Fe³⁺ & Fe²⁺

XY₂O₄ GROUP or Spinal group

Crystalizes in isometric crystal system

Normal Spinal structure: displayed by spinal & chromite series

X cation accupy tetrahedral (4-fold) sites, & Y accupy octahedral (6-fold)
Structure based on cube close backing with X & Y cation in tetrahedral site & octahedral site among O ions
General formula
XY₂O₄ → X²⁺Y₂³⁺O₄

Inverse Spinal displayed by magnetite
In magnetite unit cell contain 8Fe²⁺ in octahedra, the 16Fe³⁺ disrupted to 8 in tetrahedral & 8 in octahedral sites
XY₂O₄ → X³⁺(Y³⁺Y²⁺)O₄
XY₂O₄ group or Spinal group

Chapter 19 : Sulfides & Related Minerals

Sulfides & Related Minerals

Sulfide & related minerals

form nearly 600 minerals, few are abundant

have great economic value

Metals essential for industrial society extracted from sulfide include copper, zinc, lead, antimony, molybdenum, cobalt, nickel, silver

sulfur are law δ- than O, have about 10-20% ionic character (covalent or metallic)

There is no agreed on classification scheme

General Formula

MpXr

M: metal or semimetal
Such as: Fe, Zn, Cu, pb, Sb, or As

X: atoms
Such as: S, As, S + As, or Te

Sulfosalts

metal + semi-metal + sulfur

classified based on chemical notions that have long since been abandoned

SULFIDE PARAGENESIS

Hydrothermal Deposits: sulfide & related minerals characteristic of hydrothermal vein & replacement deposits, deposited from hot aqueous solutions in void spaces or by replacement of rock

Essential features of hydrothermal system:
1. Water
2. Heat
3. Source for metals precipitated by water
4. Migration pathways
5. Precipitation site

Water: may be meteoric, magmatic, metamorphic, or connate

Heat: by igneous intrusion, & burial

Source for metals precipitated by water: sulfur derived from crystallizing magma or leached out of rock by water

Migration pathways: Fluids flow via rock along fault, fracture, & normal pore space

Precipitation site: Minerals precipitate by filling spaces along faults, fractures, & in other voids, or by replacing minerals in rock

Supergene Processes

primary or hypogene mineralization produced in hydrothermal system extensively altered if exposed to nearsurface environment

metals found in sulfides form oxides, hydroxides, carbonates, & sulfates

Because reactions produce oxygen-bearing minerals at expense of sulfides, near zone is referred to as oxidized zone & result are called supergene or secondary minerals

Because pyrite are common sulfide, oxidized zones of most sulfide deposits colored yellow & red: iron oxides & hydroxide derived from it

These minerals insoluble & accumulate near surface to form encrusting mass “gossans

Pyrite in deeper portions of super genealteration zone serve as host to extensive precipitation of copper sulfides in supergene enrichment process

sulfide-enriched or reduced zone: zone of concentrated mineralization at water table surface

Supergene processes cause extensive alteration of country rock hosting sulfide deposits

Excess acid produced by oxidation of sulfides neutralized by reaction with silicate & form clay

A typical reaction involves hydrolysis of K-feldspar (KAlSi₃O₈) to form kaolinite:
2KAlSi₃O₈ + 2H⁺ + H₂O
→ Al₂Si₂O₅(OH)₄ + 4SiO₂ + 2K⁺
Common mineral in oxidized portion
*Chalcocite & Covellite differ in charge of sulfur
Crystal System

Pyrrhotite Vs Pyrite

In Pyrrhotite principal variation in iron content 2Fe³⁺ + Φ –> 3Fe²⁺ (> 20% Φ)

Pyrrhotite has more bronze color, & softer

Pyrrhotite weakly magnetic

The End

Native Elements

Native Elements

native elements

are unconfirme in Earth’s crust

Distribution
– Only carbon, in the form of graphite, constitutes significant rock-forming mineral
– other found as trace element (such as gold, silver, copper, & diamond, are rare & valuable)

Native element divided into 3 group
1. METALS
2. SEMIMETALS
3. NONMETALS

Part.1 : Metals & Semimetals

METALS

Divided into 3 group based on chemistry & structure
1. Gold group
2. Platinum group
3. Iron group

All have Isometric unit cell

bond: is strong metallic bond
– all are soft, & malleable
– all are good conductors of heat & electricity
– All are sectile, & opaque
Structure is cubic close packing of metal, which yields face-centered cubic unit cell
Gold Group
Substantial solid solution is possible between gold-silver & gold-copper
Gold Group
All have isometric unit cell
Platinum & Iron Groups

SEMIMETALS

Bond: more covalent, directional than metals

Unit cell : Hexagonal

Occurrence: in hydrothermal sulfide deposits as primary or secondary mineral
Semimetals

Part.2 : Nonmetals

Sulfur structure

consist of 8-fold ring covalently bonded S-atoms, bond laterally via van der Waals

3 polymorphic variety known:
2 monoclinic & one orthorhombic
Orthorhombic are common
Term carbonado applied to black or grayish bort of diamond
Crystal System

The End

Chapter Sixteen

HURRICANE

HURRICANE

– Strong Center of Low P
– Sustained winds > 74 mph, To be considered a Category 1 Hurricane
– On average there are 45 hurricanes/yr
– Size ranges from 60 miles-900 miles, with a typical size of about 400 miles
– Can last from days to weeks

What do they need to form?
– Consistent heating of the surface
– High Humidities
– Cumulus & Cumulonimbus Clouds

Formation Regions Hurricanes are called by other names (depending on where they occur)
1. Hurricanesin the Atlantic & East Pacific
2. Cyclonesin Indian Ocean near Australia
3. Typhoons off coast of China & Indonesia

Tropical Cyclone Life Cycle
1. Tropical Depression surface wind<39mph
2. Tropical Storm 39≤surface wind≤ 74mph
3. Hurricane surface winds > 74 mph

Tropical Disturbance

The majority of tropical storms & hurricanes start out as tropical disturbances

unorganized masses of thunderstorms with very little organized wind circulation

During the hurricane season in the Atlantic Ocean & Gulf of Mexico, tropical disturbances often grow from a pattern of stormy weather, called an African easterly wave

These waves typically emerge every 3-4 days off the W coast of Africa & then drift W within the trade winds into the Atlantic Ocean

If weather & ocean conditions continue to be favorable, the system may then strengthen

Tropical Depression

As a system continues to become organized & winds begin to circulate, it become tropical depression, weakest form of tropical cyclone

It is called a “depression” because it has low, or depressed, air p at its center

As the system develops, winds converge towards the center P near the center drops

During this transition, the disturbance begins to obtain its energy from the ocean not from horizontal T gradients in atm & env.wind

Tropical Storm

As bands of thunderstorms continue to develop, the depression may intensify into a tropical storm with max sustained wind speeds of 63‐117.5 km/hr

A tropical storm usually forms in this manner (from intensifying tropical depression)

Once a system is classified as a tropical storm, it is given a name

Approx. 100 tropical cyclones / yr

Many of tropical cyclones die out before they can grow stronger, with only approximately half of them (50) eventually strengthening into a mature hurricane (or typhoon)

Hurricanes

If a tropical cyclone obtains a maximum sustained wind speed > 119 km/hr, it classified as a hurricane (Typhoon or Cyclone)

At this point, the recognizable, cloud‐free eye of a hurricane typically forms

In the Atlantic, Central oe E-Pacific, hurricane intensity classified based on max surface wind speed using the 5 categories of the Saffir‐Simpson Hurricane Wind Scale

Ingredients for Hurricane Formation

Warm ocean T > 27°C, deep 200m
– need lots of evaporation
– winds churn up water → WARM water
– Both only happen equatorward of 20°N-S

Coriolis
– needed to initiate the spinning
– Need to be between > 5°N-S

Low values of vertical wind sheer
– Necessary for the storm to organize

Hurricane Structure

As air rushes inward in spiral pattern bands of clouds & thunderstorms are formed

Closer to the “eye” you get:
– The most severe thunderstorms
– The most intense rain & wind
– The eye wall has the highest wind & rain

There can be more than three sets of bands

Hurricane Intensification

The storm can intensify if there is:
Weak vertical sheer: allows condensation energy to be concentrated over a small area

Moist humid air in the upper troposphere: lots of condensation

Cold upper atm conditions: leads to a large PGF

Hurricane Damage

Wind Damages
– Hurricanes move at 45 mi/hr
– converging air moves at a faster velocity
– The velocity of the winds you experience depends on your location within hurricane
ν.motion + ν.rotation (100 + 45) m/h = 145
ν.motion – ν.rotation (100 – 45) m/h = 65

Storm Surges
– abnormal rise of sea along shore
– result of strong winds
– Can be as high as 7 m, Typically 1-2 m
– waves around 6-15 m can occur

Flooding
– Caused by intense rains that accumulate
– Rain accumulation can be up to 10 ft/day
– Typical numbers are 1-3 ft/day
Hurricane Classification Saffir-Simpson Scale

Hurricane Decay

When conditions become unfavorable the hurricane starts to decay

Colder sea surface T: < 80F will cause the storm to weaken or even dissipate

Land friction caused by large land mass, & their terrain cuts off the hurricane’s circulation, & squeezes out storm’s moisture

Shearing winds aloft
– Tropical storms & hurricanes are vertically stacked systems
– Hostile upper level wind conditions produce shearing, which blow off the high cloud tops of these storms, & causes them to become disorganized

Sinking air: subsidence from high P such as subtropical ridge can inhibit development.
– Sinking air from high P hinders thunderstorm development, which is a critical element in hurricane strengthening

In general

Hurricane Watch
– if poses a direct threat to an area
– Issued 24‐48 hr before storm arrives
– Issued by the National Hurricane Center

Hurricane Warning
– if it appears that storm will strike an area
– The warning is accompanied by a percent chance of the hurricane center passing with in 65mi of a particular community
– Typically within 36 hours

Hurricane Impact

Flooding
Storm Surge
Wind Damage
Energy of winds = wind V squared: E = V²

A doubling of the wind speed
results in 4 timesthe destructive energy

Naming Hurricanes

If reach tropical storm strength (40‐74 mph)

Used to be all women’s names
Now they alternate male‐female

Names “Retired” if cause enough damage

CENTRAL PACIFIC Has their OWN List that  used for Hawaii

HURRICANE GROUP ACTIVITIY
GROUP 1 : Super Typhoon Haiyan
GROUP 2: Hurricane Katrina
GROUP 3: Superstorm Sandy
GROUP 4: Hurricane Patricia
GROUP 5: Hurricane Rita
GROUP 6: Hurricane Andrew
Group 7: Galveston Hurricane
Group 8: Hurricane Floyd
Group 9: Hurricane Camille
Group 10: Hurricane Wilma

The End

Chapter Fifteen

TORNADOES

Tornado

rapidly rotating narrow region of low P
– form during intense thunderstorms.
– Wind speeds from 70-300 mph
– P can be as low as 900 mb

Tornado Development

Step 1: Rotating body of air at the ground
– This occurs because of vertical wind shear
A. Wind speeds increase with altitude
B. Drag & Friction: decreasing wind speed at surface

Step 2: Horizontal rotating air is lifted off the ground by the Updraft of Thunderstorm
– MESOCYCLONE: the horizontal rotating air mass if lifted vertically

Step 3: Mesocyclone is fully developed in the updraft of a thunderstorm
– If a tornado develops it descends from the slowly rotating wall cloud, in lower of cloud

Mesocyclone

vertical cylinder of rotating air, 3-10 km

Develops in the updrafts of severe T-Storms

Usually precedes tornadoes by 30 min

Stretching of the mesocyclone column causes faster rotation

Just like a figure skater, Something that begins with a larger diameter rotating at a slow speed begins to rotate faster as the tube is elongated & the diameter

Thunderstorm & Tornado

From the wall cloud a very narrow, fast rotating structure emerges

This forms a funnel cloud (as long as the cloud does not touch the ground)

As soon as the funnel cloud touches the groundit is called a tornado

Suction Vorticies

Some tornadoes have multiple suction vortices

Intense areas of high winds that are part of ONE tornado

There can be 4-6 suction vortices

The stronger the tornado the more vortices
Weak tornadoes usually don’t have them

Tornado Classification

Classified as
WEAK: rope like & narrow
STRONG: the classic funnel shape
VIOLENT: have lots of debris associated with them & can be quite dark in color

Fujita & Enhanced Fujita Scale
– Scale for Damage caused by tornadoes
– Wind Speed, Amount & Type of damage

There are 2 scales used
Fujita Scale (F)
Enhanced Fujita Scale (EF)

The End

Chapter Fourteen

Thunderstorms

Thunderstorm

Storm that generates lightning & thunder

Characterized by strong up & down motion

Produces gusty winds, heavy rain & hail

They can form in
1. conjunction with mid-latitude cycloneon the edge of a Cold-Front
2. conjunction with hurricanes

Occur in the foothills of the Rocky Mountains

Associated with drylines, different humidity

Thunderstorm Formation

Form when warm, & humid air rises in a conditionally unstable or unstable env.

There are 2 categories:
1. Air Mass Thunderstorms: formed by unequal heating of the Earth’s surface within a maritime tropical (mT) air mass
2. Severe Thunderstorms formed by unequal heating & lifting of warm air along a frontor mountain

Air Mass Thunderstorms

Happens inside an air mass (mT)

Usually in spring & summer, mid-afternoon

Not associated with a front

Due to local differences in T

Thunderstorm Life Cycle

Like mid-latitude cyclones, T-Storms have a Life Cycle

Stages of Development
Stage 1: Cumulus Stage
Stage 2: Mature Stage
Stage 3: Dissipating Stage

The Cumulus Stage
– Rising air only, Makes a bigger cloud
– Moisture is being added to higher altitudes
– Needs a continuous supply of moisture

The Mature Stage
– Precipitation, by the Bergeron Process
– Rain begins to fall, downdraft
– Updrafts & downdrafts exist side by side
– Most active stage: winds, lightning, rain, hail

Dissipating Stage
– Cooling effect of falling precipitation
–  influx of colder air up topmark it’s END
– Downdraft cuts off updraft
– Cloud stops growing
– You’re left with weakly descending parcels
– The cloud basically KILLS itself

downdraft (air going down)

form for two reasons

Entrainment: mixing of dry air with cloud air at the edge of the cloud
– Causes the cloud drops to evaporate
– Energy comes from the T of the air parcel
– Temperature drops, parcel cools
– Cooler air sinks to the surface

Drag: Air dragged downwards as precipitation falls

Severe Thunderstorms

Heavy downpours, flooding, gusty straight-line winds, large hail, lightning & tornadoes!
– NOT Common on Hawaii & Pacific Islands

To be classified as Severe:
Must have winds in excess of 93 km/h
hail 0.75 inches
a confirmed tornado

Persist for many hours Vertical wind sheer causes precipitation to fall in downdraft, allowing the updraft to retain strength
– Sometimes the updraft is so strong you get overshooting tops & anvils

Cold air of the downdrafts making: mini cold front (GUST FRONT or Outflow Boundary)
Can form a Roll Cloud

Supercell Thunderstorm

Causes dangerous weather
Large, very powerful, up to 20 km in height
Last many hours
20-50 km in diameter

Vertical wind profile may cause the updraft to ROTATE!

MESOCYCLONE usually spawns Tornadoes

Need a lot of Latent Heat
– Requires moist troposphere
– An inversion a couple of km above the surface (caps moisture)
– Unstable air can break through the inversion by “eroding” it

Lightning and Thunder

Lightning is uliain Hawaiian
Thunder is hekiliin Hawaiian

A storm is classified as a thunderstorm only after thunderis heard,

Because thunder is produced by lightning

Lightning is a discharge of electrical energy

Essentially a giant “spark” between regions of positive (+) & negative (-) charge

Lightning

Occur Between
1. cells in same storm: inter-cloud lightning
2. Within a cloud: intra-cloud lightning
3. Cloud to air
4. Cloud to ground (CG)

Forms if a charge separation occurs in cloud
1. Earth trying to equalize electrical difference
2. – ve charges want to flow to the ground

Lightning Formation (Charge Separation)

We don’t exactly know why it happens

One theory:
– Hail stonestend to have a warmer surface than ice crystals
– When warm hail collides with colder ice, electrons transfer from ice to hail
– Hail (-) is bigger & heavier & settles toward the bottom of the cloud
– Smaller (+) ice crystals are lofted to the top

Excess electrons cause the air to ionize: Rip molecules apart (N₂ or O₂ become N+, O-)
– Air is normally very INSULATING
– Ionized air is very conducting
– like a metal
– Ionized air forms tubes of 50 m in length & 10 cm in diameter (LEADER)
– A bunch of leaders that are connected is called a STEP-LEADER.
– NOTE: There still hasn’t been a flash yet!!!

Each electron contains LOTS of energy
When it reaches the surface the energy is RELEASED as HEAT, Electrons are drained at the surface first so the FLASH starts at the ground, Can have several (3-4) in rapid succession (1/10 of a second apart)
(lead by a DART LEADER)

– This is why lightning is said to GO UP, rather than down

The movement is STILL from CLOUD to GROUND–But the “heating” happens at the surface FIRST.

The electrons closest to Earth are “discharged” first

Heatthat is released causes air around a step-leader to reach 30,000°C (54,000°F)
The warmer, the shorter the shorter the wavelength

Thunder

When air is heated quickly a shockwave forms & causes thunder

Similar to planes crossing the sound barrier, firecrackers & gun shots

Sound travels at 330 m/s or 1000ft/s

If thunder takes 3 seconds to happen after observing lightning then the storm is:–3 s * 1000 ft/s = 3000 ftaway (6/10 of a mile away).

The End

Chapter eleven

Air Masses & Front

Air mass

Is big blob of air with similar properties
– Usually 1600 km across & Several km thick

FRONTAL PASSAGE Change in weather when one air mass moves out & a new air mass moves in
– Brings changes in T, P, RH, & Winds

Air masses form when they move over large regions that exhibit very similar properties

Air mass Source Regions

Polar & Tropical regions tend to exhibit such properties & therefore are good source regions

The mid-latitudes tend to be strongly variable & therefore are not good source regions

Types of Air masses

Air masses are designated by 2-letter describes basic info about T & RH
– T: Cold (Polar) or warm (Tropical)
– RH: wet (Maritime) or dry (Continental)

Symbols used
Polar (or Cold) → P
Tropical (or warm) → T, (Thenderstorm)
Continental (or dry) → C
Maritime (or humid) → M
Equatorial (from the Equator) → E
Artic (from Artic) → A
Antartic (from Antartic) → AA
For Example
mP = Maritime Polar = Cold & wet

Polar Front Theory (or Norwegian Cyclone Model)

Discovered by Norwegian scientists during World War I

Theory Mid‐Latitude Cyclones (MLCs)
– Develop in conjunction with the Polar Front
– Cold equatorward moving air collides with warm poleward moving air
– The collisions create FRONTS
– In upper atm polar front is continuous
– at the surface polar front is discontinuous
Pacific Mid-Latitude Cyclones

Fronts

Boundaries surfaces that separate air masses of different densities (related to T)
– the barrier that travels with air masses

Can be combinations of warm, cold, dry, moist

Usually 15‐200 km wide bands but narrow

Represented by narrow lines on a map

Overrunning: Warmer air (less dense) always moves above cooler air

Ideally the fronts move in approx. the same direction

Weather Behind a Cold Front

Weather behind cold fronts is characterized by SUBSIDING air

usually a continental polar (cP) air mass

usually cloudless

generally stable, limits cloud development
Warm Front, Gradual Slope
Warm Front, A warm front clouds
Cold Front, Slope is steep
Cold Front, A cold front clouds
Stationary Front, Air flow parallel to front
Occluded Front

The End

Chapter 10 Global Systems

Global Systems

Global Circulation Patterns

Single‐Cell Model
First idea
Solar energy drives the winds
Problems : Doesn’t account for rotation & in this model the whole earth is an ocean without a continentals
3‐Cell Model
Hadley Cell Equator & 30 N-S
Ferrell Cell 30 N-S & 60 N-S
Polar Cell 60 N-S & 90 N-S

Three Cell Model

Horse Latitudes

The Horse Latitudes are 25‐30 N-S

Trade winds weaken in this region, & would stall early Spanish ships sailing to NewWorld

When particular areas were too calm, they were forced to toss over their frightened horses into the sea, or eat them

The legend is the horses would swim after them for miles before they drowned, & the superstitious sailors would hear the horse screams in their haunted dreams for the rest of the voyage

Westerlies

Occur between 30‐60 N (S) Latitude

Blowing from the high P area in horse latitudes towards the poles

Steer extratropical cyclones

Can redirect Tropical Storms

The Westerlies are:
1. strongest in winter hemisphere & times, when the P is lower over the poles
2. weakest in the summer hemisphere, when P are higher over the poles

The strongest westerly winds in the middle latitudes can come in the Roaring Forties, between 40° & 50° latitude S

Roaring Forties (& Furious Fifties)

The strong west‐to‐east air currents are caused by the combination of air being displaced from the Equator to S Pole & the Earth’s rotation, & there are few landmasses toserve as windbreaks

Jet Streams

Region of the upper atmosphere where a narrow band of airmoving REALLY fast

Location of jet stream influences local weather

LARGE T contrasts

Polar Jet Stream (Mid‐Latitude)

Where the Polar Frontis located: Where the cold polar easterlies interact with the warm westerlies

It’s Geostrophic Wind if it’s high up in atm

Meanders west to east

Can exceed 500 km/hour
In winter it travels at 75 km/h
In summer 65 km/h

Subtropical Jet Stream

Semi‐permanent jet that exists over the subtropics

Is mainly a wintertime phenomenon

Due to the weak summertime T gradient, the subtropical jet is relatively weak during the summer

Slower than the polar jet

Still travels west to east

Usually at about 25 N

Usually at an altitude of about 13 km

Global Winds & Ocean Currents

Winds are the driving force for ocean currents

A relationship exists between ocean & atmosphere circulation

Ocean currents move more slowly than prevailing winds

Pacific Trash Vortex

Trash gets “Stuck” in the N Pacific Gyre

Floating mass of trash

Mostly Plastic that is non‐biodegradable

Rubber duckies got free & went all over the world following ocean currents

El Niño & La Niña

El Niño Southern Oscillation

Ocean phenomenon that occurs in the Equatorial Pacific

As the southeast trade winds decrease in strength (weaken) the warm water can make it farther across the Pacific to wards S American

Named because it starts during Christmas

Usually happens every 3‐7 years

P changes & reversals in the Pacific trigger the change in winds
La Niña Events
The opposite of an El Niño
When T colder than average T in the Pacific

The End

The Igneous Activity

Chapter 7 : Geology 101

Volcano

Volcano is a mountain formed of lava & pyroclastic materials

Crater depression at a summit of a volcano

Caldera is a Crater with depression> 1 km
– Nearly circular
– formed by collapse

Conduct (pipe) carries magma to the surface where it’s extruded from a surface opening called a vent
– connects magma chamber to the surface
– rare type to depth 200km in S Africa
necks Volcanoes on land weathered, eroded, but in pipe is more resistant & remain standing for a long while & is named neck

Vent opening in the surface via which molten rocks & gases are released

Fumaroles Vents that emit only gases

Parasitic Cones produced by volcanic activity from fissures along the flanks

Volcanoes

Violent Volcanoes: ring of fire, produce Pyroclectic materials

Quite Volcanoes: produce lava, like Hawaii

Lava flow
– It comes out from the quiet volcanoes
– 90% by volume are basaltie in composition

Pahaoehoe (ropy) Lava
– It’s name comes from Hawaii
– 10 to 300 m/hr
– Resembles braids in ropes
– control: fire boats

Aa lava
– It’s name comes from Hawaii
– 5m/hr
– Rough , jagged blocks

Viscosity

Is The measure of a material’s resistance to flow

Eruptions & Viscosity determine by
1. Composition of the magma
Granitic, Andisitic, or Basaltic
2. Temperature of the magma
3. Dissolved gasses in the magma
– gas 1 – 5 % by weight
– H₂O 70%, CO₂ 15%, N₂ & SO₂ 10%, Cl₂,H₂, Ar
– provide the force to extrude lava
– gas are expand near the surface
Pyroclastie materials
comes out from the violent volcanoes.
Those are ejected pulverized rocks , lava & glass fragments
Blocks if made of hardened lava
Bombs if lava twisted after ejected in the air

Volcanic structures & eruptive styles

Shield volcanoes broad, gently sloping, built from fluid basaltic lava
– Hawaiian islands (MaunaLoa) > 9km high
– Flanks have gentle slopes of a few degrees

Cinder cones small, built of pyroclastic materials ejected from a single vent
– They have a steep slope angle
– Frequently occur in groups

Composite cones (strato voleanoes) composed of inter bedded lava flows & pyroclastic materials
– located around pacific ocean (ring of fire)
– Large conical shape with steep summit
– more gradually sloping flanks
– Magna gas-rich with andesitic composition
– Most violent type of activity (explosive)
– Ex: Saint Helens, Andes mountains
– most destructive because of:
1. Pyroclastic flow (hot gas + Ash) which move down slope with speed 200Km/hr
2. Lahars (mud flow)

Fissures eruptions Volcanic materials are extruded from fractures in the crust
– Long narrow cracks emit low-viscosity fluid of basaltic lava termed fluid basalts
– Landscape buried by these lava produce basalt plateaus

Intrusive igneous activity

Plutons (Intrusions) are structures that result from the emplacement of magma into preexisting rocks beneath the earth surface

Intrusive igneous bodies (Plutons) are classified according to shape & orientation with respect to the host rock

Tabular intrusive bodies

Sills are horizontal concordant bodies where magma is insetal between sedimentary beds
– can change into discordant (Dike) by change there orientation

Dikes are discordant bodies that cut acoss bedding surfaces in the host rock
– can change into concordant (Sill) by change there orientation

Massive intrusive bodies

Batholiths largest intrusive bodies, usually felsic or intermediate rock, discordant
– can change into concordant (laccolith) by change there orientation

Laccolith igneous body, injected betweem sedimeniary strata & arcs the beds above
– can change into discordant (Batholiths) by change there orientation
Sill tabular, concordant, low Viscosity, Basaltic
Dike tabular, discordant , low Viscosity, Basaltic
Laccolith massive, concordant, high Viscosity, Granitic
Batholith massive, discordant, high Viscosity, Granitic

Plate tectonics & igneous activity

Most active volcanoes are
– composite cones, emit volatile-rich magma
– having intermediate composition
– located along the margins of ocean, within circum, pacific belt

Deep ocean basins, include oceanic ridges & basaltic shield volcanoes (Hawaii)

we can find all volcanoes types in Interior of the continents

Zones of igueous activity

Voleanism at convergent boundaries
– Subduction of oceanic slab triggers partial melting in upper mantle at depth of 100 km
– Partial melting caused by addition of volatiles (water) derived from the sunducting plate
– Volcanie island ares such as Marianns & coutinental volcanic ares are formed (Andes)

Volcanism at divergent boundaries
– Greatest volume of magma (60%) is produced along oceanic ridge system
– Tensional forces in the lithosphere causes reduction of confining pressure in the mobile mantle triggering decompression melting
– Partial melting produces basaltic magma

Intraplate volcanism (within the plate)
– Hotter than normal mantle material ascends upwards (mantle plume)
– It originates a the core-mantle boundary
– When the plume head reaches the top of the mantle, decompression melting produces basaltic magmia that initiates volcanism hot spot

The End

Earthquakes

Chapter 6 : Geology 101

Earthquakes

Vibration of Earth produced by the rapid release of energy

The movement of the ground, is caused by waves of energy released as rocks move along faults which means that earthquakes are associated with movements along faults

Fault a large fracture in rocks, from several m to Kms long, where rocks move along which displacement has occurred

Explained by the plate tectonics theory
Focus the point in Earth’s interior where the rocks start to fracture, origin of earthquake
Epicenter the point on Earth’s surface directly above the focus

Elastic rebound theory

earthquakes occur as rock elastically returns to its original shape

Mechanism for earthquakes was first explained by H. Reid

Elastic Rebound Theory Rocks spring back into its original shape as stress removed
Elastic Rebound
Elastic Rebound

foreshocks & aftershocks

Earthquakes are often preceded by foreshocks & followed by aftershocks

Foreshocks indication, weak earthquakes, releas some of energy

Aftershocks followed the earthquakes, releas some of energy as crust return to its original shape (crust unstable)

Earthquake waves

Seismology Study of earthquake waves
Seismograph Earthquake recording instrument, Records movement of Earth
Seismogram Record made by seismograph

Types of earthquake waves
1. Body waves: Primary (P) & Secondary (S)
2. Surface waves
Seismographs have a weight freely suspended from a support that is securely attached to bedrock
Seismogram records wave amplitude vs. time

Types of earthquake waves

Body waves: Primary waves (P)
– Push-pull (compressional) motion
– compression & expansion
– First to be recorded at a seismograph
– Travel through solids, liquids, & gases
– Greatest velocity of all earthquake waves
– longitudinal wave: Causes rock to vibrate in the same direction the wave is traveling

Body waves: Secondary waves (S)
– Shake or transverse (shearing) waves
– causes the rock to vibrate at right angles to the direction of travel (to the direction of propagation)
– Travel only through solids
– Slower velocity than P waves

Surface waves
– Complex motion
– Slowest velocity of all waves
– The largest & most destructive
– like ocean waves
Compressional Wave (P-Wave)
Shear Wave (S-Wave)
Surface waves

Locating an earthquake

Earthquake zones are closely correlated with plate boundaries
1. Circum-Pacific belt
2. Oceanic ridge system

When analysing an earthquake the first task seismologists undertake is determining its epicenter
To determine distance to epicenter
1. The difference in arrival times of P & S wave are determined from the seismogram
2. Using travel time graphs find the (S-P) interval on the vertical axis to determine the distance on the horizontal axis
A time-travel graph is used to find the distance to the epicenter
3 station are needed to locate epicenter 
Circle equal to the epicenter distance is drawn around each station 
epicenter is at Point where 3 circles intersect  

Principle for study Earth’s interior

Most of our knowledge of Earth’s interior comes from the study of P & S waves

Travel times of P & S waves via Earth depend on properties of materials

Velocity of waves increases with depth.

Seismic waves are refracted as they pass through the earth

Waves follow strongly curved paths

S waves travel only through solids 
Seismic waves follow curved paths

Earthquake intensity and magnitude 

Intensity A measure of the degree of earthquake shaking at a given locale based on the amount of damage
– measured by the Mercalli Scale

Magnitude amount of energy released
– Concept introduced by C.Richter 
– Measured using the Richter scale or Moment Magnitude scale

Magnitude Scales

Richter scale
– Based on amplitude of largest wave
– logarithmic scale: 1°→1, 2°→10, 3°→100
– Each unit = to 32-fold energy increase
– Doesn’t useful for large earthquake (>7)

Moment magnitude scale 
– Measures very large earthquakes
– Derived from the amount of displacement that occurs along a fault zone

< 2 → Micro
2 – 3.9 → Minor
4 – 4.9 → Light
5 – 5.9 →Moderate
6 – 6.9 → Strong
7 – 7.9 → Major
8 – 9 → Great

Earthquake destruction

Factors that determine structural damage
1. Intensity of the earthquake
2. Duration of the vibrations
3. The design of the structure
4. Nature of the material upon which the structure rests

Destruction results from
1. Ground shaking
2. Liquefaction of the ground
3. Tsunami, or seismic sea waves
4. Landslides & ground subsidence
5. Fires

Liquefaction caused by
1. Saturated material turns fluid
2. Underground objects float to surface
– during Liquefaction water-saturated soil behaves as a fluid. It becomes incapable of supporting much weight
– such as sandy soil
Tsunami travel times to Honolulu

Earthquake prediction

Short-range prediction
– no reliable method yet devised

Long-range forecasts
Premise is that earthquakes repetitive
– Region is given a probability of a quake

Earth’s Layers defined by composition

Crust Thin, rocky, & outer layer

Continental crust
– Upper crust composed of granitic rocks
– Lower crust is more akin to basalt
– Average density is about 2.7 g/cm³
– older than oceanic (Up to 4Ga)
– thickness 35-40 km
– thickness at some mountainous 70 km

Oceanic Crust 
– Basaltic composition 
– Density about 3.0 g/cm3
– Younger (<180Ma) than the continental
– thickness 7km

Mantle : Below crust to 2900Km depth
– Composition : of the uppermost is igneous peridotite & changes at greater depths

Core : A sphere having a radius of 3486 km
Location Below mantle
– Composition : iron-nickel alloy
– density ≈ 11 g/cm3

Earth’s Layers defined by physical properties

Lithosphere Crust & Uppermost mantle
– 100km thick
– Cool, rigid, & solid

Asthenosphere Beneath the lithosphere
– Upper mantle
– To a depth of about 660Km
– Soft, weak layer that is easily deformed

Mesosphere lower mantle
– 660-2900 km
– More rigid layer
– Rocks are hot & capable of gradual flow

Outer core Liquid layer
– 2270 km thick
– Convective flow of metallic iron within generates Earth’s magnetic field

Inner Core Sphere with a radius of 1216km
– Behaves like a solid

Rock Deformation

Deformation general term refers to changes in the original shape & size of a rock body

Most crustal deformation occurs along plate margins

Rocks deform permanently in 2 ways:
1. brittle deformation
2. ductile deformation

Brittle deformation is the fracturing of an object once its strength is exceeded

Ductile deformation type of solid state flow that produces a change in the size & shape of an object without fracturing the object

Stress

Stress is the force/unit area acting on a solid

Strain is the change in shape or volume of a body of rock as a result of stress

Types of Stress
1. Tensional stress
2. Compressional stress
3. Shear stress

Geologic Structures

Anticlines Fold upfolding or arching of strata

Synclines Fold downfolds in strata
– found in association with anticlines

Domes circular or elongated structure, produces by upwarping of the crust
– Older rocks are exposed in the center
– the youngest rocks exposed in the flanks

Basin circular or elongated structure, produces by upwarping of the crust
– youngest rocks are exposed near the center
– the oldest rocks exposed near the flanks

Faults: are fractures in the crust along which displacement has taken place
Every fold has 2 limbs
Symmetrical Fold : if dip angle of 2 limbs equal each other
Asymmetrical Fold : if dip angle aren’t equal
Overturned Fold : the 2 limbs dipping in tha same direction
Domes
Fault

Faults

Dip- slip Faults: movement parallel to dip
1. Normal fault: occur if the hanging wall block moves down relative to the footwall
2. Reverse fault: hanging wall block moves up relative to the footwall block
3. Thrust fault: reverse with dips < 40°

Strike-slip faults are faults in which the movement is horizontal & parallel to the trend, or strike, of the fault surface

fault-block mountains

formed as large blocks of crust are uplifted & tilted along normal faults

Grabens formed by downward displacement of fault-bounded blocks

Horsts are elongated, uplifted blocks of crust bounded by faults

Mountain Building

Folded Mountains formed by compressional forces

Orogenesis result in forming of mountains

Young mountain belts (less than 100Ma):
1. American Cordillera
2. Alpine-Himalaya chain
3. volcanic island arcs (Philippines, Japan)

Older mountain belts
1. Appalachians in N-America
2. Ural Between Europe & Asia

Occurrence

Most mountain building occurs at convergent plate boundaries

Colliding plates provide the compressional forces that fold, fault, & metamorphose the thick layers of sediments deposited at the edges of landmasses

Ocean-Ocean Convergence produces volcanic mountains (volcanic islands arc)

Ocean-Continental Convergence volcanic mountains & folded mountains


Accretion process that occurs when crustal fragments collide with & stay connected to a continental plate

Accretionary wedge is the accumulation of different sedimentary & metamorphic rocks with some scraps of ocean crust

Terranes any fragments that have a geologic history distinct from that of the adjoining fragments
– Terranes occur along the Pacific Coast
Ocean-Ocean Convergence
Ocean-Continental Convergence
At a convergent boundary a collision between the continental fragments will result & form folded mountains
Mountain Building by Continental Accretion

The End

Lab.7 : Stratigraphy

Geologic Time II

What is the order of events from oldest to youngest

Solutions

The End

Lab.6 : Stratigraphy

Geologic Time

types of geologic time

Relative events are arranged in their order of occurrence (without date)

Ex. in a sequence of flat lying rocks, shale is on top of sandstone. The shale is younger, but how much younger is not known


Absolute the actual age of the geologic event

This is usually done using a radiometric- dating technique

Principle for Relative Geologic Age

Original Horizontality sedimentary rocks are deposited as horizontal layers
– Any marked deviation from horizontality indicates deformation of the crust occurred after deposition of the inclined layer

Law of Superposition: in an ordinary vertical sequence of sedimentary rocks, the layer at the bottom of the sequence is oldest, & successively higher layers are successively younger

Cross-Cutting Relationship Principle Younger features cut older

The Principle of Inclusion if rocks or rock  fragments are included within another rock, the rock fragments must be older
According to superposition Law
A must have been deposited first (oldest)
D must have been deposited last (youngest)
The cross-cutting relationships Principle
A is the oldest since it is intruded by dikes
B older than dike C since it is cut by dike C
Therefore A followed by dike B & then dike C
The sedimentary sequence A – D (oldest to youngest) have been deposited first
A – D was then folded & subsequently eroded (erosion surface E)
After erosion, F was deposited
A & B are offset by fault D, so they have been formed prior to faulting, & C isn’t offset so it have been formed after faulting occurred
(A) Sedimentary beds 1–3 were deposited as horizontal layers. Sometime later, a normal fault occurred
(B) Sedimentary beds 1–7 were deposited as horizontal layers. Later, these beds were folded into an anticline. Later still, the anticline was truncated by an erosional unconformity, & finally, an 8 was deposited as a horizontal layer Inclusions of older rock fragments (from 1–7) found at the base of 8

Unconformities

Unconformity is a surface that corresponds with a gap in sedimentation, due to erosion & nondeposition

Rocks above an unconformity are younger than those below it

3 types of unconformities
angular unconformity in which beds above & below the surface aren’t parallel
nonconformity sedimentary layers overly crystalline rocks (igneous or metamorphic)
disconformity in which beds above & below the surface are parallel, but the surface itself is irregular, exhibiting evidence of erosional relief

In geologic block diagrams & cross-sections, unconformities are drawn as wavy line

Geologic Time Scale

By correlating outcrops from place to place, & using the Principle of Superposition, it has been possible to determine the sequence in which sedimentary rocks were deposited.

This information, coupled with the fossil record, led to the development of the Geologic Time Scale.

The various subdivisions are based on major changes in the history of the Earth as documented by the geologic record.

The time scale is a relative time scale, & Ages are attached to the various geologic periods using radiometric dating.

that the geologic time scale is based on the sedimentary record while radioactive dating is applied to igneous & metamorphic rocks

Radiometric Dating

Radioactive decay spontaneous breakdown of a nucleus

The radioactive isotope is the Parent Isotope & the decay product is the Daughter Isotope

half-life of a radioactive element is the length of time it takes for 50% of the parent isotope to decay

The mineral zircon, which contains trace amounts of U but usually no Pb, is often used to determine the age of igneous rocks. The idea is that the zircon grains crystallized from the magma & therefore are the same age as the rock
exponential relationship

Exercises

Arrange the events from oldest to youngest
1. Arrange the events from oldest to youngest
2. between C & E (& B) there is unconformity, What is the name of unconformity?
1. Arrange the events from oldest to youngest
2. between H & A (& F) there is unconformity, What is the name of unconformity?
A is a sandstone (sedimentary rock)
B is a basalt dike (tabular igneous intrusion)
C is a diorite dike (tabular igneous intrusion)
Zircon grains are separated from the basalt dike & the diorite dike & The number of 235U & 207Pb atoms is determined for a zircon from the basalt dike & diorite dike.
The data are shown in the table. Because we want to calculate the age in millions of years, λ = 9.8458 x 10-⁴ my-¹

For each of the following diagrams, label with letters & numbers each layer, body, fault, & unconformity, & then determine the correct order in which the various rock units & other features occurred

Complete Table 2 by filling in the Age column
Use your knowledge of relative dating to determine the correct sequence of rocks in the diagram. Using the absolute ages you calculated in exercise above

Solutions

The End

Lab.5 : Stratigraphy

Inclined Strata

Inclined Strata

الطبقات المائلة

الصخور الرسوبية تكون افقية ولكن تتأثر بالحركات الارضية حيث ربما تميل أو تنثني أو تتصدع .. ألخ

الطبقة المائلة: هي الطبقة التي يميل سطحها السفلي والعلوي عن المستوى الأفقي بزاوية ٠ < الميل < ٩٠°

يمكن في الحقل تحديد مقدار مضرب الطبقة وميلها واتجاهه باستعمال البوصلة الجيولوجية

Horizontal strata طبقات افقية
Inclined Strata طبقات مائلة
Strike المضرب
Dip زاوية الميل

Strike lines

خطوط المضرب (خطوط الامتداد)

المضرب: خط وهمي أفقي موجود على سطح الطبقة ويمر بنقاط ذات ارتفاع واحد على سطح الطبقة، وهي خطوط متوازية، ولها اتجاه واحد، والمسافة العمودية بينها متساوية.

خطوط المضرب توضح ارتفاعات سطح الطبقة، وخطوط الكنتور توضح ارتفاعات سطح الأرض

مقدار المضرب: وهو قيمة ارتفاعه من سطح البحر
اتجاه المضرب: يحدد بالبوصلة الجيولوجية وهو عمودي على اتجاه الميل الحقيقي للطبقة

فترة الكفاف: المسافة الرأسية بين أي خطي مضرب متتاليين
المسافة المضربية: المسافة الافقية بين خطوط المضرب

خطوط المضرب تتقارب من بعضها البعض إذا كان ميل الطبقة شديدا وتتباعد كلما قل، أي أن المسافة المضربية تتناسب تناسبا عكسيا مع الميل، وتتناقض قيم منسوب خطوط المضارب في اتجاه الميل أي المضرب الذي يلي مضرب ۷۰۰ في اتجاه الميل هو مضرب ۹۰۰ ويليه مضرب ٥٠٠ وهكذا
True dip الميل الحقيقي
Contour interval فترة الكفاف
Strike interval المسافة المضربية
ل

الميل الحقيقي والظاهري

الميل الحقيقي: زاوية الميل الأعظم بين مستوی سطح الطبقة والمستوى الأفقي وهو عمودي على خطوط المضرب في اتجاه تناقص قيم الخطوط

زاوية ميل الطبقة: الزاوية المحصورة بين خط الأفق وسطح الطبقة، ويحدد مقدار واتجاه زاوية الميل بالبوصلة الجيولوجية
ظل (زاوية الميل) = فترة الكنتور \ المسافة المضربية
tan(θ) = CI/SI

الميل الظاهري : الزاوية بين مستوى الطبقة ومستوى أفقي في أي اتجاه غير اتجاه الميل الأعظم، قيم الميل تتناقص في اتجاه خط المضرب حتى يصل صفر وتتزايد مرة أخرى
ظا (الميل الظاهر) = الكنتور/المسافة المضربية الظاهرة
tan(θ) = CI/SI

المسافة المضربية الظاهرية يتزايد الميل الظاهري باتجاه خط المضرب (زاوية الميل الأعظم) باتجاه الميل الحقيقي، ثم يقل حتى يصل للصفر باتجاه المضرب ويتزايد مرة أخرى وهكذا..

True Dip Angel الميل الحقيقي
خطوط المضرب والميل الحقيقي والميل الظاهري
الميل هو انحراف الطبقة عن الأفق ولا علاقة له بالانحدار

الانحدار: انحراف سطح الأرض عن الوضع الأفقي بالطبقات وقد يتفق الميل والانحدار باتجاه واحد، وقد يكون اتجاه أحدهما عكس اتجاه الآخر

حساب زاوية الميل

في الشكل بالاسفل (المثلث ا، ب، ج)
ا-ب = المسافة المضربية
ب-ج = الفترة الكنتورية
tan (θ) = CI/SI

عادة ما تكون الفترة الكنتورية = ۱۰۰م، وهي تمثل الفرق بين قيمة خطي مضرب متتاليين

ا

Ex. Calculate the Strike Interval (SI), If you know that the strata is Inclined at an angle of 30°, & the map scale 1:10,000

CI = 100m
θ = 30°
tan(θ) = CI/SI → SI = CI/tan(θ)
SI = 100m/tan(30°) = 173m——i
1 cm on map = 10,000cm actual
1 cm on map = 100m actual
173m = 1.73cm on map———ii

نقطة الظهور ومكشف الطبقة

نقطة الظهور: نقطة يظهر فيها سطح الطبقة عند سطح الأرض أي أن نقطة الظهور هي نقطة مشتركة يكون فيها منسوب سطح الطبقة مساويا لمنسوب سطح الأرض (يتساوی عندها منسوب خط الكنتور مع منسوب خط المضرب)

تستخدم نقاط الظهور لرسم خطوط المضرب ومكشف الطبقة

مكشف الطبقة: الجزء الظاهر من الطبقة على سطح الأرض

لرسم مكشف الطبقة

رسم مكشف الطبقة بمعلومية ٣ نقاط ظهور مختلفة بالقيم
١. نمد خط بين اقل نقطة واعلى نقطة
٢. نجزء الخط الى عدة اجزاء تساوي الفرق بين منسوبيهما مقسوما على الفترة الكنتورية
ΔSL/CI
٣. نمد خط من النقطة الثالثة من اطار الخريطة الى الاطار يمر في منتصف الخط بين النقطتين (الاعلى والاقل)
٤. نمد خطين من الاطار الى الاطار كل واحد يصل بنقطة من النقطتين الاعلى والاقل موازيان للخط الاول
٥. نمد خطوط اخرى تساوي عدد الخطوط المحسوبة بالخطوة ٢
٦. نقيس المسافة بين الخطوط باستخدام المسطرة فنحصل على المسافة المضربية ونكمل رسم خطوط المضرب للخريطة
٧. نحدد جميع نقاط الظهور (النقاط الاي يتساوى فيها الكنتور مع المضرب) ونمد بينها خط يصل بها جميعها وهو مكشف الطبقة

رسم مكشف الطبقة بمعلومية ٣ نقاط اثنتين منهما متساويات
١. نمد خط من الاطار الى الاطار يمر بالنقطتين المتساويات
٢. نمد خط موازي له على طول الخريطة
٣. نقيس المسافة بين الخطين ونتبع الخطوات بالحالة الاولى (٦ و٧)

لرسم خطوط المضرب بمعلومية مكشف الطبقة
١. نحدد جميع النقاط التي تتقاطع بها سطح الطبقة مع خطوط الكنتور
٢. نرسم بينها خطوط تمر بنقاط متساوية بالارتفاع
٣. نقيس المسافة بينها فنحصل على الفترة المضربية ونكمل الخطوط

سمك الطبقة

سمك حقيقي: مسافة عمودية بين سطحي طبقة علوي وسفلي
سمك رأسي: مسافة راسية بين سطحي طبقة علوي وسفلي
سمك ظاهري: مسافة بين منحنى ظهور السطح العلوي ومنحنى ظهور السطح السفلي للطبقة عند موضع معين، ويتوقف على زاوية ميل الطبقة وانحدار سطح الأرض
أب = السمك الحقيقي
اج = السمك الراسي الظاهري للطبقة
جتام = السمك الحقيقي / السمك الرأس

حساب عمق الطبقات المائلة من الآبار

يعرف عمق الطبقة عند نقطة معينة بأنه المسافة الرأسية من سطح الأرض إلى سطح الطبقة العلوي أو السفلي، ويؤخذ العمق عادة بالنسبة للسطح العلوي ما لم يذكر غير ذالك

لتحديد عمق طبقة مائلة تحت السطح من بئر حفر على سطح الأرض
١. نجد ارتفاع البئر (من قيمة خط الكنتور الذي يمر بحفرة البئر)
٢. نطرح من ارتفاع البئر ارتفاع سطح الطبقة (من قيمة خط المضرب للسطح “ارتفاع سطح الطبقة”)
عمق الطبقة = منسوب سطح الارض – منسوب سطح الطبقة
عمق الطبقة = الكنتور لنقطة البئر – المضرب على للطبقة
احسب عمق الطبقة (E) عند النقطة (أ)
النقطة أ تقع على خط كونتور ٧٠٠م ويمر منها خط مضرب بمنسوب ٥٠٠ ،اذا عمق الطبقة عند أ = ٧٠٠ – ٥٠٠ = ٢٠٠م

رسم القطاع الجيولوجي للطبقات المائلة

١. رسم القطاع الطبوغرافي
٢. نحدد على شريط الورق تقاطع مكشف أسطح الطبقات مع خط القطاع، ثم ننقل هذه النقاط على المحور الأفقي للقطاع
٣. ترفع هذه النقاط رأسيا حتى تقابل خط البروفايل
٤. نرسم خط افقي أعلى البروفيل، ومن أحد نهايتيه نرسم زاوية الميل بواسطة منقلة باتجاه الميل
٥. نرسم خطوطة موازية لخط زاوية الميل وتمر بنقاط أسطح الطبقات الموجودة على خط البروفايل يمكن أيضا رسم هذه الطبقات باستخدام خطوط المضرب أي تقاطع خطوط المضرب مع خط القطاع، وباستخدام ثلاث نقاط أو أكثر نحصل على سطح الطبقة

يجب تحديد اتجاه القطاع ومقياس الرسم على القطاع

إذا رسم القطاع الجيولوجي في اتجاه موازي لخطوط المضرب فإن الطبقات تظهر علی القطاع الجيولوجي أفقيا، وعند رسم القطاع في هذه الحالة تتبع الخطوات السابقة من نقاط تقاطع مکاشف أسطح الطبقات مع خط البروفيل ترسم منها أسطح الطبقات من وضع أفقي

فيديو

Learning video Geologic cross section

سلسلة مفيدة شرح للطبقات المائلة

فيديو رسم مكشف الطبقة العلوي والسفلي والقطاع الجيولوجي

Lab.4 : Stratigraphy

Geologic cross section

لرسم المقطع الجيولوجي

1. نرسم المقطع الطبوغرافي
2. نحدد سُمك كل طبقة ونوع الصخر الذي تحتويه – ان امكن –
3. نرسم الطبقات داخل الخريطة الطبوغرافية التي رسمناها
4. نرسم العمود الجيولوجي ونكتب بجانبه نوع الصخر وسمك الطبقات

Exercise

1. اكمل الطبقات
2. حدد الاقدم والاحدث
3. ارسم المقاطع المُبينة

Τhe End

Lab.3 : Stratigraphy

Topographic Profile 2

Gradint

Steepness of a slope

Gradint = Relief / distance = ΔΥ/ΔΧ

خطوات رسم المقطع الطبوجرافي

1. تحدد على الخريطة اتجاه الشمال
2. تحدد موقع النقاط التي تريد الرسم بينها بالنسبة الى الشمال
3. تحدد الابعاد الطبوغرافية على ورقة
4. تسقط الارتفاعات المحددة على ورقة رسم بياني
5. ترسم خط بين النقاط ويجب ان لا يحتوي زواية حادة
6. تحدد تحت كل من النقطين اسفل الخريطة موقعهما بالنسبة للشمال والمسافة بينهما
7. اذا طلب منك حساب الميل تطبق القانون الموجود بالاعلى

Worksheets

Describe the landscape corresponding to the contour map (from SW to NE)
Complete the contour line (CI = 10m)
What is the maximum elevation?
Complete the contour line (CI = 10m)
What is the maximum elevation?
Draw the profile (1)
Draw the profile (2)
Draw the profile (3)
Draw the profile (4)
1. What is the contour interval?
2. What is gradient between X & Y (m/km)?
3. What is the maximum elevation?
4. Draw the profile (5) between A & B

Hint. G ≈ 14.2 m/Km

The End

Lab.2 Stratigraphy

Topographic profile

Terms

Topography is the study of geographical features on a landscape.

Topographic map is the map represent the 3D landscape of Earth within the 2D space of a map, use a colors, shading, & contour lines to represent changes in elevation, & shape

Cartographers map makers

each contour line represents an equal point of elevation, then any change in elevation would lead to inconsistent line spacing

Several contour lines spaced close together would indicate steep terrain, & lines spaced far apart would indicate gentler slope

Contour intervals the change in elevation between any two contour lines

3 kinds of contour lines

index line (I) thickest, labeled with number

Intermediate (Ln) thinner, more common, lines between the index lines, usually don’t have a number label, 1I =  5Ln

supplementary appear as dotted lines, indicating flatter terrain

Topographic Features

Peak Ring The innermost ring at the center of contour loops, represents highest elevation, & Sometimes the peak will be represented with a small X & number denoting elevation

Depression Ring an inner ring indicates a lowest elevation, which the map will show with a series of small tick marks pointing toward the center called hachures

Cliff 2 or more lines converge until they appear as a single line.

Valley (draws) When contour lines cross a valley or a stream, they make a sharp pointed V or U-shape. Rivers will run through the center of the V-shape. Sometimes called

Ridgeline like an elongated peak, not coming to a fine point. Instead of a closed inner circle, a ridgeline can look like a big oval

Saddle low lying area between 2 higher points of elevation. They appear as hourglass shapes between 2 concentric circles

Ledge Ledges or flat areas on the side of a mountain appear as protruding U-shapes that point away from the peak

Map Scales

The scale of a map is the ratio of a distance on the map to the corresponding distance on the ground

ratio scale represented as a fraction or ratio
– for example 1:100 means one unit X on a map represents 100X on the surface
– Ex. 1:200: 1cm on map = 200cm true

Graphic scale or bar scale 
– is usually printed in the lower margin of Topographic maps 
– bar acts as a ruler for measuring distances

Generating profiles

Draw a line between the 2 points bounding the desired profile area

Place a folded sheet of paper along the line

Mark each contour line intersecting the paper

Indicate the vertical height with a dot on a scale

Connect the height dots with a smooth line
Step 1: Draw a line between the 2 points bounding the desired profile area
Step 2 : Place a folded sheet of paper along the line
Step 3 : Mark each contour line intersecting the paper
Step 4 : Indicate the vertical height with a dot on a scale
Step 5 : Connect the height dots with a smooth line

Examples

Exercises

Worksheet 1
1. The river flow in ____ Direction
2. The Sea location ______
Worksheet 2
What is the elevation of points (A, B, C, D, E)
Worksheet 3
Draw the topographic profile

Solutions

Worksheet 1
1. South West to North East (SW → NE)
2. North east (NE)

Worksheet 2
1.4cm → 250m
1cm → 178.6m
A = 750m + (0.3cm*178.6m/cm) = 804m
B = 500m + (0.7cm*178.6m/cm) = 625m
C = 500 + (0.4cm*178.6m/cm) = 571m
D = 250 + (0.4cm*178.6m/cm) = 321m
E = 250 – (0.4cm*178.6m/cm) = 179m
Worksheet 3

Lab.1 Stratigraphy

Topographic Maps

Topographic Maps

are 2D map representation of 3D surface that show the location of every natural feature within the map’s area

Map Directions

Maps direction is geographic (true) north

In maps that don’t contain a direction, We always assume that the N → up on the map

Contour lines

lines on topographic maps that represent equal elevations above sea level (0), & represent 3D features on the paper

Contour Intervals The difference in elevation between 2 contour lines

Relief differences in elevation between 2 point

Index contour line between 5 contour line

Map Scales

The scale of a map is the ratio of a distance on the map to the corresponding distance on the ground

ratio scale represented as a fraction or ratio
– for example 1:100 means one unit X on a map represents 100X on the surface
– Ex. 1:200: 1cm on map = 200cm true

Graphic scale or bar scale
– is usually printed in the lower margin of Topographic maps
– bar acts as a ruler for measuring distances

Reading & drawing a map

To find the elevation of a point on a map
1. The elevation can be determined directly if the point is located on contour line
2. If the point is located between contour lines, its elevation must be estimated

rules for drawing contour lines
1. Represent only one elevation
2. never divide or split
3. the 2 ends of a contour line must join
4. never intersect other lines
5. will bend & form a V pattern (streams)
6. Closely spaced indicate a steep slope
7. widely spaced indicate a gentle slope
7. Rings indicate mountain
8. Rings of hachured indicate a depression
Mountains → Closed contour lines (rings)
Depressions → Closed contour lines (rings)
are hachured include tick marks
the smallest ring (lowest ring) is centermost
Cortoutlines that are almost parallel to one another represent slopes
Steep Slopes contour lines are close together
Gentle Slopes contour lines are wider apart
The closer the contour lines, the steeper the slope
Direction of a stream

Examples

Worksheet 1 : Use this map to answer the following questions

Questions

1. the creek flowing ____ of Pikitigushi Lake
A. into
B. out

2. A creek joins Lake E from W, the creek flow ____ of Lake E?
A. into
B. out

3. You are walking south, from B to C, you are
A. gaining elevation
B. losing elevation
C. remaining level

4. If You walk from B to D. You Are _____
A. going up a steep hill
B. going down a gully
C. going up a gully

5. You are standing at point A, What is your height above sea level?

6. You are standing at point A, What is your height above lake?

7. From B, towards Lake, Describe topograpic features between B & the lake

Worksheet 2 : Use this map to answer the following questions

Questions

1. What is the contour interval?

2. What are the small marks on the contour lines on the right side of the map called?

3. What do the small marks on the contour lines to the right indicate?

4. What is the approximate elevation of A?

5. What is the elevation of contour line B?

Solutions

Worksheet 1

1. Into (A)

2. Out (B)

3. (B > 1,350ft, C < 1,350) losing elevation (B)

4. going down a gully

5. A lacated at 1,250ft above the sea level

6. A located at 1,250ft & lake located at 950ft – both above sea level -, then elevation of point A above lake = 1,250 – 950 = 300ft above lake

7. B lacated over a mountain with elevation approximately 1360ft, and toward the lake there are GENTEL SLOPE, & then become STEEP SLOPE

Worksheet 2

1. CI = 10m

2. small marks called HACHURED

3. small marks indicate DEPRESSION

4. the approximate elevation of A = 15m

5. the elevation of contour line B = 20m

The End

Chapter Nine

Online Quiz

Wind : Mesoscale

Part1: Scales of Atmospheric Motion

3 Scales of Atmospheric Motion

Eddy

Whirl of air, Come in different sizes

Small volume of air behaves differently from the large flow in which it resides

Eddies are down wind from the obstacle

Caused by encountering an obstacle
In stable air wind produce
small eddies & little vertical Mixing
In unstable air wind produce
large eddies & high vertical Mixing that produce strong & gusty surface wind
Formation of clear air turbulence along a boundary of increasing wind speed shear

Part2: Mesoscale

Local Winds (Mesoscale)

Caused by topographic effects or variations in local surface composition

Include
1. Land & Sea Breezes
2. Valley & Mountain Breezes
3. Chinook Winds (Foehn Winds)
4. Katabatic Winds (Fall Winds)
5. Santa Ana Winds
6. Haboobs Winds (Desert Winds)
7. Dust Devils
8. Country Breezes
Land and Sea Breezes
Country Breezes
Associated with large urban areas that are warmer than the rural (country)
City is warmer (urban heat island effect)
The wind is light & blows from rural areas toward the cities
See most often on clear, calm nights

Part3 : MONSOON

MONSOON

Seasonal change in global circulation
Refers to Seasonal reversal of wind direction

Caused by Alternation between 2 weather patters

Doesn’t mean rainy season
Winter Monsoon
Winds blow off the continents (dry air)
Summer Monsoon
Wind move from the sea to land (moist air)

The End

Plate Tectonics

Chapter 5 : Plate Tectonics

Part1 : Plate Tectonics Theory

Continental Drift

hypothesis by Alfred Wegener, 1915

The hypothesis: Supercontinent began breaking apart about 200 My ago
– Continents drifted to present positions
– Supercontinent called Pangaea
Pangaea, 200Ma

Evidence used in support of continental drift hypothesis

Fit of the continents, Fit of:
– the shore lines
– continental shelves edges at 900m depth

Fossil Distribution of fossils like Mesosaurus found in black shales of Permian age

Rock type & structural similarities 
Matching mountain ranges

Paleoclimatic evidence
– Paleozoic 300Ma, ice sheets covered of SH, & India, & Now these are tropical & subtropical
– in NH large tropical swamps existed that became major coal fields of eastern USA, Europe, & Siberia now
Rock typee & structural similarities
fossil evidence

The Great Debate

Objections to the hypothesis
– Lack of a mechanism for moving continents
– Strong opposition to the hypothesis

Continental drift & the scientific method
– Wegener incorrectly suggested that continents broke through the ocean crust, much like ice breakers cut through ice
– Wegener’s hypothesis was correct in principle, but contained incorrect details
A few scientists considered Wegener’s ideas plausible & continued the search

Plate Tectonics Theory PTT

All the following led to PTT, Oceanographic exploration after WW2, discovered:

Global oceanic ridge systems

Dredging in the seafloor didn’t bring up oceanic crust older than 180Ma

Earthquake studies revealed tectonic activity beneath deep-ocean trenches

Sediment accumulations in the deep-ocean basins were found to be thin
Mid-Atlantic Ridge
the youngest in red & orange, yellow, green, & older, & The blue rocks date to the Jurassic 150 -200Ma when Atlantic started to grow
Earth’s major plates
there are 7 major lithospheric plates
Plates motion & changing in shape & size
Some plates include continent + seafloor
Plates move at a rate 5cm/yr
Lithospheric plates

Part2: Plate boundaries

Plate boundaries

Interactions among individual plates occur along their boundaries

Types of plate boundaries
Divergent: constructive margins
Convergent: destructive margins
Transform fault: conservative margins
Types of plate boundaries
Types of Convergent Plate Boundaries
subducting plate: The plate that slides, oldest, cooler, denser
over riding plate: younger, less dense
oceanic ridges: elevated areas of seafloor characterized by high heat flow & volcanism
– Length 70,000km, 20% of earth surface
– Width 1000 – 4000kms
– Crest of ridges 2-3 km above seafloor
rift-valley: deep down-faulted structure along the axis of some ridge segments

Continental rifting

splits landmasses into 2 or more smaller segments along a continental rift

Produced by extensional forces on plates

such as East African rift valleys

Ridge system & ocean basin formed if
1. Upwarping of the crust associated with mantle upwelling
2. stretching lithosphere breaks crustal rocks produced continental rift
3. Rift valley lengthens & deepens forming Linear sea
Harry Hess envisioned new sea floor being created at the mid-ocean ridge & destroyed in deep ocean trenches

Part3 : TESTING THE PLATE TECTONICS MODEL

Evidence from ocean drilling

Age of deepest sediments seafloor spreading produced by drilling ocean-floor sediment

Thickness of ocean-floor sediments verifies seafloor spreading

Hot spots & mantle plumes

Hot spot area of volcanism, high heat flow, & crustal uplift

Caused by rising plumes of mantle material
Mantle plumes
– Upwelling of hot rock
– Some originate at great depth
– perhaps at the mantle-core boundary
– As hot plume ascends via mantle confining P decreases causing partial melting
– This activity is seen as hot spot on surface

As Pacific plate moves over hot spot a chain of volcanic structures is built
Hawaiian Island chain showed increasing age of volcanoes towards NW

Paleomagnetism

Earth has a magnetic field similar to that produced by a simple bar magnet, & AFFECTS ALL MAGNETIC OBJECTS ON EARTH

Most Fe-bearing minerals are:
– magnetic
– gain magnetization below Curie point T
– align themselves in the direction of the existing magnetic lines of force

Rocks that formed millions of years ago contain a “record” of the direction of the magnetic poles at the time of their formation (fossil magnetism)

Apparent polar wandering
– Lava flows of different ages indicated several different paleomagnetic poles positions within the same continent
– Polar wandering curves are more readily explained by the theory of plate tectonics

Magnetic surveys were also done in the ocean floor using a magnetometer

magnetometer instrument used to measure magnetic intensity

The surveys showed high & low intensity magnetic stripes within the ocean floor which are symmetrical along the opposite side of the ridges

When rocks exhibit the same magnetism as the present magnetic field, they are said to possess normal polarity. & Rocks with the opposite magnetism are said to have reversed polarity, Dates when the polarity of Earth’s magnetism changed were determined from lava flows
Magnetic reversals & seafloor spreading
Earth’s magnetic field periodically reverses polarity, the N magnetic pole becomes the S, & vice versa (reversed polarity)
Magnetic reversals
Geomagnetic reversals are recorded in the ocean crust
In 1963 Vine & Matthews tied the discovery of magnetic stripes in the ocean crust near ridges to Hess’s concept of seafloor spreading

Forces that drive plate motion

Convective flow in the mantle
Slab pull
Ridge push
Slab suction

The End

Chapter Eight

Online Quiz

Pressure & Winds

AIR PRESSURE

Is the Force exerted against a surface by the continuous collision of gas molecules

Is the P exerted by the weight of the air above

The Ρ differences causes the air to move from higher Ρ toward a region of lower Ρ

Pressure Units

At sea level:
1 atmosphere (atm)
14.7 pounds/inch² (p/in²)
101,325 Newton/m² (N/m²)
101,325 Bascal (Pa)
1013.25 millibars (mb)
29.92 inch of mercury (inHg)
760 millimeter of mercury (mmHg)
76 cm of mercury (cmHg)
760 torr

SI unit is the pascal
1 mb = 100 N/m² (Meteorologists use thies)
1 mb = 100 Pa

Bascal (Pa) is the force (1N) acting on a unit aria (1m²)

DAILY P VARIATIONS

The largest P difference, about 2.5mb, occurs near the equator

daily (diurnal) fluctuation of P are due to the absorption of solar energy by O₃ in upper atm & H₂O in lower atm

thermal tides (or atmospheric tides): The warming & cooling of the air creates density oscillations, that show up as small pressure changes near the earth’s surface

Measuring Pressure

Barometer Fluid Filled, liquid mercury
Aneroid barometer No fluid, Aneroid cell
Recording Barograph An aneroid barometer, records a P over time

Why is mercury rather than water used in the barometer? convenience
– Mercury seldom rises to > 80 cm
– A water is 13.6 times less dense than Hg, an atm P of 76 cmHg, would be equivalent to 1034 cmH₂O
– A water barometer resting on the ground near sea level would have to be read from a ladder over 10 m tall
Barometer

Influence of Τ & Water Vapor

Warm Air Faster molecules, less dense, low P
Cold Air Slower molecules, denser, high P

Add H₂O makes air lighter (less Dense):
Cold, & dry → Higher P, Higher ρ
Warm, & dry → low P than Cold, dry
Cold, & humid → less than warm & dry
Warm, & humid → Lowest P, & lowest ρ
cold,dry> warm,dry> cold,wet> warm,wet
Isobars A Map View of Pressure
Contours lines or curves of constant P
They are corrected for altitude to equivalent Sea Level Pressure (SLP)

Pressure & Wind

Wind is nature’s attempt at balancing inequalities in pressure
– Unequal heating generates inequalities in P

Winds flow from high to low pressure

Wind caused by
→ Solar radiation (SR) is the source of energy
→ SR causing differences in heating (O₃ absorb it in upper atm, & H₂O in lawer)
→ Unequal heating causes horizontal differences in pressure HDP
→ HDP cause PGF (causes wind to start move)
→ the wind flow from region of high P to regions of low P under PGF due to HDP

Main forces that affect wind
1. Pressure Gradient Force (PGF)
2. Coriolis Force (rotation of the Earth)
3. Centripetal force
4. Friction
5. Gravity

2 forces cause wind speed & direction to be different than predicted by the PGF
1. Coriolis (rotation of the Earth)
2. Friction

Wind flow in a straight line from high to low P If Earth didn’t rotate & there was no friction

Winds flow from High to Low P if affected by HPD that caused PGF

The gas law: P α (ρ x Τ)
                         PV = nRT → P = (mRT)/VMw
                         P = (ρRT)/Mw → P α (ρ x Τ)
Winds flow from High to Low P if affected by Horizontal Pressure Differences (HPD)
Change in P over large distance = small PGF
Change in P over small distance = large PGF
PGF & Isobars
PGF is at right angles to isobars

PGF STRONGER if isobars are closer together

When given P Heights, the PGF points from regions of High P to that of Low P

If all we had was the PGF, wind would act like a Ball rolling down a slope… rolling at 90° to the slope!

Coriolis Force Fc

Results from the rotation of the Earth
– Earth rotates 15°/hr

Causes PGF to cross isobars not at right θ
– Winds curve to the RIGHT in the NH
– Winds curve to the LEFT in the SH

Affects wind direction, not speed

Affected by (factors determine the magnitude of the Coriolis Force)
1. wind speed
– Stronger wind → greater force
2. latitude dependent
– Strongest at the poles
– nonexistent at the equator
On a non‐rotating Earth, the rocket would travel straight to it’s target

Even though the rock travels in STRAIGHT line, when we plot it’s path on the surface it follows a path that CURVES to the RIGHT!
Coriolis Force Fc
Geostrophic Flow: winds run parallel to isobars in a straight path if
– only the PGF & Fc affect an air parcel
– air parcel is at equilibrium, if PGF & Fc opposite in direction
Curved Flow: wind that follow curved paths around high & low pressure cells

Speed of the wind depends on how close is the isobars are

Friction

Applied to wind within 1 to 1.5 km of the surface

direction of Friction
– direction always opposite of motion
– direction towards of the PGF
– direction of the low P
– direction opposite of the Fc

affects air at the surface more than air aloft (decreases with hight)
Combining the forces
Geostrophic Flow & Friction together causes parcel to slow down
Fc decreases in strength

Vertical Motion & Pressure

Movement of air can cause variations in P
Net flow of air into a region = CONVERGENCE
Net flow of air out of a region = DIVERGENCE
High: Anticyclonic divergent, clockwise flow
Law: cyclonic convergent, counterclockwise

Factors that promote vertical air flow

Friction can cause convergence & divergence

ocean vs land as air move
– from ocean to the land wind slows down
– from land to ocean → divergence & subsidence

Stream
– as air move upstream →convergence
– as air move downstream →divergence

Mountains hinder the flow of air
– As air passes over it → divergence aloft
– After going over → horizontal convergence

Prevailing Winds

Name given to the wind direction
– observed during a give time period
– Can affect the climate of a region
– Helpful for city planning
Wind Rose
Diagram that represents the percentage of time the wind blows from different direction

The End

Chapter Seven

Online Quizzes

Cloud droplets growth

processes of rain produced

Forms of Precipitation

Precipitation

Cloud droplets growth

If a cloud droplet is in equilibrium with its surroundings its size doesn’t change because rate of condensing onto the droplet = rate of evaporating from it

If cloud droplet is not in equilibrium its size
– increase if condensation > evaporation
– decrease if condensation < evaporation

To keep the droplet in equilibrium more vapor molecules are needed around it, to replace molecules that evaporating from it

In equilibrium, The total number of vapor molecules around the droplet remains constant & defines the droplet’s saturation vapor pressure

equilibrium vapor pressure is the saturation vapor pressure at equilibrium
a Cloud droplet is 100 times smaller than a raindrop
Cloud drops are VERY TINY (0.02 mm)
Rain drops are VERY BIG (2 mm)

curvature effect

When air is saturated with respect to a flat surface, it is unsaturated with respect to a curved droplet (Evaporate)

As a result of curvature effect to keep smaller cloud droplets in equilibrium
→ smaller droplets has greater curvature
→ so more rapid rate of evaporation
→ so require greater vapor pressure
→ The air must be supersaturated (RH>100%)

since the smaller nuclei are more affected by curvature effect, only the larger nuclei are able to become cloud droplets
Reason is the water molecules are less strongly attached to a curved water surface, they evaporate more readily
curvature effect
The evaporation over a flat surface of water is less than evaporation of same amount of water over a curved surface

Solute Effect

Condensation begins on tiny particles called cloud condensation nuclei (CCN)

Hygroscopic particles: type of CCN, have an affinity for H₂O, & Condensation begin on it when the RH < 100%, such as salt particles

Salt are dissolve in water forming solution & the salt ions in solution bind closely with H₂O so preventing it from evaporate

solute effect: reduces the equilibrium vapor pressure, by strong association of hygroscopic molecules with water in solution

Due to the solute effect:
1. the salt replaces H₂O in lattice structure
2. the equilibrium vapor pressure is lowered

droplet containing salt can be in equilibrium when the RH << 100%

Should RH increase:
→ water vapor molecules would attach to the droplet at a faster rate than they would leave
→the droplet would grow larger in size

Condensation in Unsaturated air

In moist but unsaturated air:
– condensation occurs as air cools, RH ≈78
– As the air cools further, RH increases, with the droplets containing the most salt reaching the largest sizes.

Over land masses where large concentrations of nuclei exist, several hundreds/cm³, all competing for the available supply of H₂O(g)

Over the oceans where the concentration of nuclei is less, < 100/cm³, but larger cloud droplets

So, in a given volume we tend to find
1. more cloud droplets in clouds over land
2. larger cloud droplets over the ocean

processes of rain produced

Collision‐Coalescence process
Bergeron: the ice‐crystal process

COLLISION & COALESCENCE PROCESS

Air retards the falling drops

The amount of air resistance depends on:
1. rate of fall
2. The size: larger fall faster!
3. Speed: mire speed → more air encounters
4. Coalescence: Large droplets collide & merging with smaller drops in their path

Terminal Velocity: constant speed of falling drop if the air resistance =F.gravity
– The speed of the falling drop increases until the air resistance equals the pull of gravity

larger drops fall faster than smaller drop larger drops have a smaller surface area to weight ratio, they fall faster before reaching their terminal velocity

Coalescence enhanced if colliding droplets have opposite & attractive electrical charges

Rising air currents in a forming cloud, slow the rate of fall toward the ground

amount of time the droplet spends in the cloud An important factor influencing cloud droplet growth by the collision process

Thick cloud with strong updrafts maximizes
1. the time cloud droplets spend in the cloud
2. the size to which they can grow
In warm cloud composed of small droplets of uniform size, the droplets are less likely to collide as they all fall very slowly at about the same speed, droplets that do collide, do not coalesce because of the strong surface tension that holds together each tiny droplet

In a cloud composed of droplets of varying sizes, larger droplets fall faster than smaller droplets. Although some tiny droplets are swept aside, some collect on the larger forward edge, while others (captured in the wake of the larger droplet) coalesce on the droplet’s back side
warm rain Rain that falls from warm clouds
The most important factor in the production of raindrops is the cloud’s liquid water content.

In a cloud with sufficient water, other significant factors are:
1. the range of droplet sizes
2. the cloud thickness
3. the updrafts of the cloud
4. the electric charge of the droplets and the electric field in the cloud

Bergeron Process

process of ice crystal growth that occurs in mixed phase clouds (containing a mixture of supercooled water and ice) in regions where the ambient vapor pressure falls between the saturation vapor pressure over water and the lower saturation vapor pressure over ice.

This is a subsaturated environment for liquid water but a supersaturated environment for ice resulting in rapid evaporation of liquid water and rapid ice crystal growth through vapor deposition

Precipitation in Cold Clouds

Ice, water & water vapor exist at the same time

Cloud drops DON’T FREEZE at 0°C

Liquid water won’t freeze until ‐40C°, SUPERCOOLED

Supercooled water freezes when it touches a Freezing Nuclei, FN are rare

ICE-CRYSTAL PROCESS

The ice‐crystal (or Bergeron) process of rain formation is extremely important in middle and high latitudes, where clouds extend upward into regions where the air temperature is well below freezing.

Such clouds are called cold clouds.
a typical cold cloud that has formed over the Great Plains, where the “cold” part is well above the 0°C isotherm
Eventually the ice crystals will grow large enough to fall.
The Bergeron Process often results in liquid precipitation.
As the crystals grow and fall, they pass through the base of the cloud, which may be above freezing.
This causes the crystals to melt and fall as rain.

The Bergeron Process
Summary

The air reaches saturation and some of the resulting droplets will come in contact with freezing nuclei (assuming they have reached the activation temperature).

There is then a combination of ice crystals and supercooled water droplets.

From the perspective of the supercooled droplets, the air is in equilibrium at saturation, but from the perspective of the ice crystals, the air is supersaturated.

water vapor will sublimate on the ice crystals. Since the amount of water vapor in the air has decreased, and from the perspective of the supercooled water droplet, the air is subsaturated, the supercooled water will evaporate until the air once again reaches saturation.

The process then continues.

In short summary, the ice crystal grows through sublimation at the expense of the supercooled water droplet.

Precipitation in Warm Clouds

In warm clouds there are no Ice Crystals so the Bergeron Process can’t operate

Collision‐Coalescence a.k.a. Bump & Stick

Need one BIGGER than average Cloud Drop

Really large aerosol (CCN) → Start Big…. End Big

Entrainment Mixing (evaporation & redistribution)

Turbulence (smashing together of droplets)

Collision-Coalescence

Terminal Velocity matters

the highest velocity attainable by an object as it falls through the air

Sum of the drag force and buoyancyequals the downward force of gravity

If cloud drops were all the same size could they bump into each other? NO

BIG drops fall FASTER than SMALL drops!!!
How ice crystals grow & produce precipitation in clouds with a low H₂O(ι) content & a high H₂O(ι) content

Cloud Seeding & Precipitation

The primary goal in many cloud seeding experiments is to inject (or seed) a cloud with small particles that will act as nuclei, so that the cloud particles will grow large enough to fall to the surface as precipitation.

Some of the first experiments in cloud seeding were conducted by Vincent Schaefer & Irving Langmuir during the late 1940s.

To seed a cloud, they dropped crushed pellets of dry ice (solid carbon dioxide) from a plane. Because dry ice has a temperature of ‐78°C (‐108°F), it acts as a cooling agent.

“Fake Ice” to simulate the Bergeron Process (Dry Ice, Silver Iodide)

In 1947, Bernard Vonnegut demonstrated that silver iodide (AgI) could be used as a cloud‐ seeding agent.

Because silver iodide has a crystalline structure similar to an ice crystal, it acts as an effective ice nucleus at temperatures of ‐4°C (25°F) & lower.

Silver iodide causes ice crystals to form in two primary ways:
1. Ice crystals form when silver iodide crystals come in contact with supercooled liquid droplets.
2. Ice crystals grow in size as water vapor deposits onto the silver iodide crystal.

Cloud Seeding & Precipitation

Hard to “prove” that it actually worked.

Need the right ratio of cloud droplets to ice crystals.

Concern over toxicity of silver iodide.

You can “overseed” a cloud and too many ice crystals are formed so it doesn’t rain

You can also “overseed” cold fog with dry ice to dissipate it.

Forms of Precipitation

Snow & Hail is seen on Big Island
Sleet, Glaze, & Rime do not seen on Big Island

Rain

Drops of water that fall from a cloud & have a diameter of at least 0.5mm

atm is warm, above freezing, from the surface to the cloud layer (Hits the surface as a liquid)

Rain can start out as an ice crystal (Bergeron) or as a large droplet (Collision‐ Coalescence)

DRIZZLE & MIST: Small drops

Virga: Rain that evaporates before reaching the surface

Flooding, Flash Flood
Atmospheric Profile for Rain

Snow

Ice crystals & clumps

atm is cold, below freezing, from the surface to the cloud layer (Hits the surface as solid ice)

Snow will start out as ice crystal (Bergeron)

Very Cold Conditions
light snow: Individual crystals

Warmer Cold Conditions
wet snow: Crystals form clumps
Atmospheric Profile for Snow

Sleet

Rain that freezes near the surface, Wintertime phenomenon

atm is cold, below freezing, in the cloud layer & at the surface, & there is a layer in between that is above freezing

(Hits the surface as solid ice pellets)
Precipitation (from snow) → rain → sleet

Clearto translucent pellets (Ice Pellets)
Atmospheric Profile for Sleet

Freezing Rain & Glaze

Rain falls in liquid & then freezes at ground

atm is cold (below freezing) in the cloud, above the surface there is a warm (above freezing) layer than melts the snow.

just at the surface there is a layer of below freezing that causes the rain drop to freeze on contact with the surface

Glaze The coating of ice
Profile for Freezing Rain

Hail

Rounded WHITISH Pellets & Irregular lumps of ice, 1‐5 cm & Can weigh > pound

Can be very destructive & damage cars, crops, & even kill people!
The hail Formation
Produced in a Cumulonimbus cloud
Graupleor large frozen rain dropsact as embryos

They accumulate supercooled water, adding new layer

Violent, upsurging air currents within the storm carry these embryos up via the cloud

Low liquid water makes a white layer
Higher liquid water makes a clear layer

When the updraft can no longer keep it aloftit falls to the surface

The more violent the storm the larger the hail can become.

Rime

This is a deposit of ice crystals

Formed by freezing of supercooled fog or cloud droplets on objects whose surface is below freezing

The End

Chapter Six

Online Quiz

Stability & Cloud Development

Adiabatic Lapse Rates

Adiabatic process

dry adiabatic rate DAR = 10°C/Km
If parcel of unsaturated air expands & cools, or compresses & warms, with no interchange of heat withits surroundings

The Rate of adiabatic cooling or warming remains constant “only to unsaturated air”

Wet adiabatic rate WAR ≈ 6°C/Km
As the rising air cools, its RH increases, & at the Td, RH becomes 100%

Further lifting results in condensation, a cloud forms, & latent heat is released inside the rising air parcel

The air no longer cools at the DAR but at a lesser rate. Because the heat added offsets some of the cooling due to expanding

Lifted Condensation Level (LCL)

The height at which air that is cooling at the DAR becomes saturated & condensation begins

Processes that Lift Air

Orographic Lifting: forced over a mountain

Convergence forced to rise as it collides

Frontal Wedging: air is forced up due to difference in air T or ρ

Localized Convective Lifting differential  heating, Air is forced to rise to heating air & lowering its density
Localized Convective Lifting
Unequal heating of surface causes pockets of air to be warmer than the surrounding air
Buoyant parcels (thermals) of hot air rise

Convergence
When air flows in from > one direction (not a front) can collides, It cannot go down
happens over islands & other regions where 2 bodies of water are located closely together
Orographic Lifting
Rain shadow desert
Frontal Wedging
Warmer, & less dense air, is forced over cooler, & denser air
Front: when warm & cold air collide

Air Parcels

Imaginary volume of air
– a few hundred m³

ASSUMPTION
1. no heat is transferred into, or out of it
2. Acts independently of the surrounding air
3. HIGHLY IDEALIZED

We use them to
1. Determines if the air will rise or sink by comparing parcel of air to its surrounding
2. predict if clouds will form

Adiabatic Lapse Rates ALR

WALR & DALR help us to
1. Understand if a parcel will rise or sink
1. Determines if a cloud will form
2. Determines type, & height of clouds
Dry Adiabatic Lapse Rate (DALR)=10°C/Km
The change in T due to a change in altitude of a non‐condensing parcel
Wet Adiabatic Lapse Rate (WALR)≈ 6°C/Km
The change in T due to a change in altitude of a condensing parcel

Environmental Lapse Rate (ELR)

Actual measureable T change with height

Atmospheric stability

Atmospheric stability referring to a condition of equilibrium

Stable Air (Tair < Tsur.)

If a parcel cooler than the surrounding, it would be more dense, so sink back to it’s original position

Air resists vertical (up & down) motion

Air is in stable equilibrium when it tends to return to its original position

Unstable Air (Tair > Tsur.)

If a parcel warmer than the surrounding, it would be less dense, so rise to an altitude where it’s T equaled that of surrounding

Air that is in unstable equilibrium will move away from its original position
Types of Stability
1. Absolute Stability
2. Absolute Instability
3. Conditional Instability Determined by measuring air T at different heights & comparing it to the ELR
Absolute Stability
When the ELR < WALR < 6°C/Km
Absolute Unstability
If the ELR > DALR > 10°C/Km
Conditional Instability
When DALR > ELR > WALR (10 > ELR> 6)

Stability & Daily Weather

If stable air is forced up, the associated clouds have little vertical thickness & precipitation is light

Clouds associated with unstable air are towering & accompanied by heavy rain

Thunderstorms produced by the unstable air that caused by the passing hurricanes

Changes in Stability

Stability is enhanced by the following
1. Radiation cooling of surface after sunset
2. The cooling of an air mass from below
3. General subsidence within an air column (sinking)
Stable atmosphere are cooling from below & warming aloft

Instability is enhanced by the following
1. Solar heating warming the lower atm
2. The heating of an air mass from below
3. Upward movement of air
4. Radiation cooling from cloud tops
Unstable atmosphere are heating from below & colling aloft

Vertical Air Movement

Subsidence downward motion of air

Stabilizes the air if the air above is warmed

Can result in the evaporation of clouds

Summary

ALR

DALR = 10°C/Km, Non-Condensing air

WALR ≈ 6°C/Km, Condensing air

Atm Stability

Stable air : Tp < Ta, sink

Unstable air : Tp > Ta, rises

Neutral : Tp = Ta, stay in its hight

Types of Stability

Absolute Stability:
ELR < WALR, ELR < 6°C/Km

Absolute Instability:
ELR > DALR, ELR > 10°C/Km

Conditional Instability :
DALR > ELR > WALR, 10 >ELR> 6

The End

Landscapes fashioned by water

   Earth’s Processes

Earth’s Processes

External Processes: Occur at or near Earth’s surface, Weathering, Masswasting, & Erosion
Internal processes: derive their energy from Earth’s interior, Mountain Building & Volcanic Activity

Mass Wasting

is the downslope movement of rock & soil due to gravity
Controls & triggers of mass wasting:
1. Water: Reduces the internal resistance of materials & adds weight to a slope
2. Oversteepening of slopes
3. Removal of vegetation: Root systems bind soil & regolith together
4. Earthquakes & aftershocks: dislodge large volumes of rock & unconsolidated material

Mass Wasting Types

Slide material contact with the surface
– It can preserve its form or deformed
include
1. Rock slides or land slides translation movement along a planer surface
2. Slump rotational along concave surface

Fall free fall, looses contact with surface

Flow movement of unconsolated material saturated with H₂O with other behaving in a plastic to liquid manner, contact with surface
– Individual particles get rearranged
– include
1. Dibri flow (or solifluction flow)
2. Earth flow
3. Mud flow

   Water Cycle

is a circulation of Earth’s water
Processes in the water cycle
Precipitation Water returns to earth
Evaporation transfer from liquid to solid
Infiltration water absorption by Rock & soil
Runoff Water returns to water bodies
Evapotranspiration Evaporation by plants
Sublimation: transfer from the gaseous state of the solid or liquid
Condinsation forms clouds
In hydrologic cycle output = input, rate of Evaporation = rate of preciptation
Water distripution at the earth surface

Running Water

Stream flow

Stream water running in a channel
The ability of a stream to erode & transport materials is determined by velocity
Factors that determine velocity
1. Gradient, or slope: vertical drop of a stream over a specified horizontal distance
2. Discharge: The volume of water moving past a given point in a certain amount of time
2. Channel characteristics:
Shape: V-shaped (up) & Semicircle (down)
size: directly proporational to velocity
roughness: inversaly proporational to velocity
Profile
Cross-sectional, view of stream
headwaters (source)
Viewed from the head, to mouth of a stream
Up stream (Head)
law velocity, law discharge, small size, steep gradient, V-shaped, & Rough
Down stream (Mouth)
high velocity, high discharge, large size, gentle gradient, semicircle, smooth curve

Drainage basins & pattern

Drainages

Drainage Basins: Drainage networks, land area that contributes water to the stream Drainage pattern: interconnected network
Drainage Basins include Tributary, River, Delta, & Ocean
divide: Imaginary line separating one basin from another
drainage basin
divide
Common drainage patterns
Dendritic, Radial, Rectangular, & Trellis

River systems

River systems

divided in 3 zones based on the dominent processes operating within them:
1. Zone of Sediment Production
2. Zone of Sediment Transport
3. Zone of Sediment Deposition

Base Level

Base level: is the lowest point to which a stream can erode
Two general types of base level
1. Ultimate (sea level)
2. Local (temporary)
There are 2 forms of river erosion
1. Down cutting esosion
2. Lateral esosion
Changing conditions causes readjustment of stream activities
1. Raising base level causes deposition (decreasing in velocity & Gradient)
2. Lowering base level causes erosion (increasing in velocity & Gradient)
Adjustment of Base Level to Changing Conditions

The Work of Streams

Stream erosion

Lifting loosely consolidated particles
Abrasion & Dissolution
Potholes formed when a strong current moves large paticles
Potholes in channel floor

Transport of sediment by streams

stream’s load Transported material
Types of load
1. Dissolved load (in solution) 115-120 ppm
2. Suspended load (silt & clay)
3. Bed load (down cutting of stream)
Competence the max. particle size stream can transport, Determined by the stream’s velocity
Capacity the max. load a stream can transport per time, increases with discharge

Deposition of sediment by a stream

Caused by a decrease in velocity
– Competence is reduced
– Sediment begins to drop out,each particle size has a critical settling velocity
Solid particle of various size separated(sorting)
Stream sediments (alluvium) well sorted

Stream channels

Bedrock channels found in headwaters, steep gradient, V-shaped, rivers cut into bedrock. Waterfalls & pot holes are usually seen
Alluvial channels composed of loosely consolidated sediment (alluvium)

2 types of Alluvial channels

Meandering: move in sweeping bends, found in downstream, becomes mendering because if lateral erosion
Braided consist of network of converging & diverging channels (load consists of coarse material & the stream has high discharge)
Meandering channels
Braided channels

Forms of deposition of sediments by streams

Delta Body of sediment where a stream enters a lake or the ocean
Natural leveesForm parallel to the stream channel by successive floods over many years
Floodplain deposits
Delta
Results from a sudden decrease in velocity
Natural levees
Formation of Natural Levees
Formation of Back swamps
Yazoo tributaries

Stream Valleys

Common landforms on Earth’s surface
Two general types of stream valleys
1. Narrow valleys
– V-shaped
– Downcutting toward base level
– Features often include rapids & waterfalls
2. Wide valleys
– Stream is near base level
– Downward erosion is less dominant
– Stream energy is directed from side to side
– forming a floodplain
Features of wide valleys often include
– Floodplains
– Meanders
– Cut banks & point bars
– Cutoffs & oxbow lakes
Erosion & Deposition Along a Meandering Stream

Floods & Flood Control

Floods are the most destructive hazard
Causes of flooding
Result from naturally occurring & human induced factors
Causes include
   – heavy rains
   – rapid snow melt
   – dam failure
   – topography, & surface conditions
Flood control
1. Engineering efforts: Artificial levees, Flood control dams, & Channelization
2. floodplain management Nonstructural approach

Water Beneath the Surface

freshwater

Largest freshwater reservoir for humans
Geological roles
1. erosional agent, dissolving by groundwater produces: Sinkholes, & Caverns
2. An equalizer of stream flow

Distribution of groundwater

Belt of soil moisture
   – Zone of aeration
   – Unsaturated zone
   – Pore spaces of material are filled with air
Zone of saturation
   – All pore spaces of material filled with H₂O
   – Water within the pores is groundwater
Water table upper limit of zone of saturation
Groundwater provides streams with water

Movement of groundwater

Porosity Percentage of pore spaces to the total volume of the rock.
– determines how much groundwater can be stored
Permeability Ability to transmit water via connected pore spaces
– Pores must be connected & large enough to allow movement
Aquitard impermeable layer of material (clay)
Aquifer permeable layer of material (sand & gravel)
confined aquifer confined between 2 aquitard
unconfined aquifer water table forms the upper boundary

Springs

Whenever the water table intersects surface
Hot springs
– Water 6 – 9ºC warmer than air temperature
– depth increase of temperature by 2°C/100m 
– Heated by cooling of igneous rock
Geysers
– Intermittent hot springs in which columns of water are ejected with great force at various intervals
– Water turns to steam & erupts
– occur where extensive underground chambers exist within hot igneous rocks
– At the bottom of the chamber, the water is under great pressure preventing water from boiling at 100°C

Wells

Well a hole bored in the zone of saturation to remove groundwater
Artesian Wells Water in the well rises higher than the initial groundwater level
– Artesian wells act as “natural pipelines” moving water from remote areas of recharge great distances to the points of discharge
Formation of a Cone of Depression
Pumping cause a drawdown (lowering) & a cone of depression in the water table
An Artesian Well Resulting from an Inclined Aquifer

Environmental problems associated with groundwater

– Treating it as a nonrenewable resource
– Land subsidence caused by its withdrawal
Contamination

Geologic work of groundwater

dissolves rock
Groundwater if often mildly acidic
Contains weak carbonic acid
CaCO₃ + H₂CO₃ → Ca⁺ + 2HCO₃-
Calcite → bicarbonate ion carried away in solution
Dissolves calcite in limestone

Caverns Formed by dissolving rock beneath Earth’s surface, in the zone of saturation
– Composed of dripstone
– Calcite deposited as dripping H₂O evaporates
Features found within caverns
1. Stalactites hanging from the ceiling
2. Stalagmites (dripstones) growing upward from the floor

Karst topography

Formed by dissolving rocks at or near surface
Area lacks good surface drainage
Common features
1. Sinkholes Surface depressions, form by dissolving bedrock & cavern collapse
2. Caves & caverns

Important terms

Groundwater is the largest reservoir of fresh water that is readily available to human.
Zone of aeration underground area above water table, is not fully saturated with water
Zone of saturation underground area below the water table in which the pore spaces are fully saturated with water
Water table surface that separates zone of aeration, from underlying zone of saturation
Porosity the proportion of open spaces (or pores) in sediment or rock, expressed as the percent of voids to the total rock volume
Aquifer a permeable layer of sediment or rock from which water can be obtained
spring is a naturally occurring intersection of the water table with the surface of the ground from which water flows spontaneously
A well is an opening bored down into the zone of saturation and into a confined aquifer
Overpumping resulting in
– cone of depression around the pumping well
– intrusion of salt water into freshwater well
– land subsidence
– causing damage to an aquifer resulting in such a significant water level decline
Permeability Ability to transmit water via connected pore spaces
Porosity Percentage of pore spaces to the total volume of the rock.
Drainage basin land area that contributes water to a stream
Divide imaginary line which separates drainage basins
Gradient the slope of stream channel expressed as the vertical drop of a stream over a specified distance
Discharge the volume of water flowing past a certain point in a given unit of time
base level is a lower limit to how deep a stream can erode
Meandering river generally move in a sweeping bends
Cutoff the new & shorter channel segment of meandering river, is for the outer edge of a meander, because of its shape called Oxbow
Delta may form where a river deposits sediments in another water body at its mouth
Natural levees result from sediment deposited along the margins of a stream channel by many flooding events
streams transport load of sediments in :
1. solution (dissolved particles)
2. suspension
3. along the bottom of the channel (Bed load)

The End

Rocks: materials of the solid earth

Geology 101

The rock cycle
describes the interactions between the components of the Earth system
Origin of igneous, sedimentary, & metamorphic rocks & how they connected
Any rock can be transformed into any other rock type under the right conditions

The rock cycle

The rock cycle begins with magma
Forms from melting in crust & mantle
Less dense magma rises toward the surface
Erupts at surface as lava, cools within crust

Magma: generated by melting in the mantle, & some by melting the crust, & Rises because it is less dense than surrounding rock

lava: Magma reaches Earth’s surface

Cooling is crystallization or solidification

Igneous rocks are crystallized from
Magma: within the crust
– lava: at Earth’s surface
Igneous rocks exposed at Earth’s surface undergo weathering
Atmosphere decomposes rock
Generates loose material or dissolves it

Loose material is called sediment
Transported by gravity, running water, glaciers, wind, waves, etc.
Most sediment is transported to the ocean, but some is deposited in other environments

lithification: Deposited sediment “conversion into rock” by Compaction & Cemention

Metamorphism: Deformed by great heat & pressure if deeply buried or incorporated into a mountain chain

heat can melt the rock & generate magma

Rocks aren’t stable unchanging masses over geologic time scales, & Rock cycle happens over millions or billions of years

Different stages of the rock cycle are occurring today all over Earth’s surface
– New igneous rocks are forming in Hawaii
– The Colorado Rockies are eroding & material is being carried to the Gulf of Mexico

Rocks don’t always go through the rock cycle from igneous to sedimentary to metamorphic
– Igneous remain deeply buried & become metamorphosed
– Sedimentary & metamorphic uplifted & eroded into sediment instead of melted

The rock cycle is driven by internal heat & external processes (weathering & erosion)

Processes for transform a rock
Igneous form if molten magma crystallizes
Sedimentary form if weathered particles are lithified (compaction & cementation)
Metamorphic rocks form when other rocks are exposed to heat & pressure

Igneous Rocks

Formed by Fire, form when magma or lava cools & crystallizes

extrusive or volcanic rocks: Solidification of lava at Earth’s surface
– Abundant in the NW (Cascades, Columbia)
– Many oceanic islands are volcanic (Hawaii)
Most volcanic eruptions are not violent

intrusive or plutonic rocks: magma never reaches the surface, & solidifies
Exposed at the surface by uplift & erosion
– Mount Washington (New Hampshire)
– Stone Mountain (Georgia)
– Mount Rushmore & Black Hills (S-Dakota)
– Yosemite National Park (California)

Magma contains ions (Si, O) & gas (H₂O) confined by pressure, & solid crystals

Crystallization occurs as mobile ions arrange into orderly patterns during cooling

As cooling continues, more ions are added to the crystals until all of the liquid becomes a solid mass of interlocking crystals

Igneous classified by
Texture: results from cooling history, interloking texture
Mineral composition: derives from parent magma & environment of crystallization

The texture

described based on size, shape, & arrangement of grains

Used to make inferences about rock’s origin
Large crystals → slow cooling → common in magma chambers deep in the crust
Fine-grainedrapid cooling → at the surface or in small masses in the upper crust
– crystals small to see with the naked eye
vesicular voids left by gas bubbles that remained when lava solidified (scoria)
Coarse-grained →Solidified at depth while insulated by surrounding rock
– Masses of interlocking crystals roughly the same size (large to be seen by the naked eye)
Porphyritic Large crystals in matrix of smaller crystals
Different minerals crystallize under different T-P conditions & One mineral can reach large size before other minerals start to form
Glassy texture when rocks cool rapidly
Atoms freeze in place before they can arrange themselves in an orderly structure
More likely in silica-rich magmas
Form during volcanic eruptions

Composition

Igneous rocks mainly composed of silicate
Si & O + (Al, Ca, Na, K, Mg, Fe) make up 98% of most magmas, & includes small amounts of trace elements Ti, Mn, Au, Ag, U
During crystallization, these elements combine to form 2 major groups of silicate
Dark silicates: rich in Fe & Mg, low in Si such as Olivine, pyroxene, amphibole, biotite
Light silicates contain Na, K, Ca, richer in Si such as Quartz, mica, feldspars
Feldspars are most abundant mineral group 40% of most igneous rocks

Crystallization influenced by
Magma composition
Dissolved gas
Rate of cooling
– Slow cooling → fewer, large crystals
– Quick cooling → tiny intergrown crystals
– Instantaneous cooling → randomly distributed atoms, no crystal growth (formation of volcanic glass)

Volcanic ash: tiny shards of glass
Magma can evolve
Different rock generated from the same melt
Bowen’s reaction series describes which minerals solidify at specific T
First crystallize olivine, pyroxene, plagioclase
at intermediate T: Amphibole & biotite
during late cooling: Muscovite & K-feldspar
last to solidify: Quartz
Minerals that form in the same T range tend to be associated in the same igneous rocks
Granitic (felsic) rocks
Igneous rocks of granitic composition made up almost entirely of light-colored silicates
Quartz + potassium feldspar
Felsic = feldspar + silica
Most contain 10% dark silicate minerals
Biotite mica, amphibole, 70% silica
Major constituent of continental crust
Granite: coarse-grained rock
Forms when magma solidified slowly at depth, & Uplifted during mountain building
Rhyolite: extrusive equivalent of granite
Light-colored silicates, buff, pink, or grey
Contains voids & fragments of volcanic glass
Cooled rapidly at Earth’s surface
Obsidian: natural volcanic glass
Dark in color (metallic ions) & high Si content
Chemical composition is similar to light-colored rocks
Pumice: vesicular volcanic glass
Gas escape from lava forms a frothy, gray
Many float in water because of vesicles

Basaltic (mafic) rocks
Contain substantial dark silicate minerals & Ca-rich plagioclase but no quartz
Mafic = Mg + ferrum (Fe)
Darker & denser than granitic because of Fe
Basalt: Most common extrusive rock
Dark green to black, fine-grained
Contains pyroxene, olivine, & plagioclase
Relatively common at Earth’s surface
Volcanic islands (e.g., Hawaii, Iceland)
Upper layers of the oceanic crust
Central Oregon & Washington
Gabbro: coarse-grained intrusive equivalent
Not commonly exposed at Earth’s surface
Significant component of oceanic crust

Andesitic (intermediate)
between granitic & basaltic composition
Mixture of both light & dark colored mineral
Amphibole & plagioclase feldspar
Associated with volcanic activity at continental margins
diorite: Coarse-grained intrusive equivalent

Ultramafic rocks
Contain mostly dark-colored minerals
Olivine and pyroxene
e.g., peridotite & dunite
Rare at Earth’s surface
Main constituent of upper mantle
Magmatic differentiation
formation of one or more secondary magmas from a single parent magma
Explains diversity of igneous rocks
Magma composition continually changes during cooling
As crystals form, certain elements selectively removed, resulting in depleted magma

Crystal settling occurs when dense minerals sink to the bottom of a magma chamber
Summary
Classification of igneous rocks depend on
Crystal size: Coarse, Fine, Porphyritic, Glassy, & Vesicular
Composition: Granitic (felsic), Basaltic (mafic), Andesitic (intermediate), Ultramafic

Size of crystals related to cooling rate
Larger crystals indicate slower cooling
Smaller crystals indicate fast cooling

Sediments

Weathering & Erosion

Weathering break down of rocks, transformation of rock to reach equilibrium with environment, form Sediment
– Natural response of materials to a new environment
– Generally occur simultaneously

2 basic categories of weathering
mechanical (physical) process of breaking down rocks into smaller pieces, Each piece retains same physical properties of original material & increases surface area
chemical alters internal structure of minerals, Elements are removed or added

Ex. Mechanical Weathering
Frost wedging
Sheeting
Biological activity

How does mechanical weathering break rocks?
1. Break into smaller pieces but chemical composition does not change
2. Increases surface area for chemical weathering

How does chemical break rocks down?
1. Oxidation or dissolution by carbonic acid
2. changes mineral’s crystalline structure

Erosion transports weathered rock
Mechanical weathering
Increases surface area available for chemical weathering
Frost wedging (Mechanical weathering)
occurs when water fills cracks in rocks & expands, & Ice expands 9% when it freezes
Most pronounced in mountainous regions in middle-latitudes
Sheeting (Mechanical weathering)
occurs when entire slabs of intrusive igneous rock break loose, Removal of overlying rock reduces pressure & outer layers expand & separate
Exfoliation Domes occure due to Continued weathering (release pressure)
Biological activity (Mechanical)
breaks rocks apart
Roots grow into cracks & wedge rock apart, & Burrowing animals expose rock to increased weathering
chemical weathering
rock is transformed into new stable material
Oxidation Oxygen dissolved in water
carbonic acid CO₂ dissolved in water, & Abundant at Earth’s surface, & Interaction with minerals changes their structure
Feldspar are broken down into clay minerals
Silica is carried away by ground water
Quartz is very resistant to weathering

Sedimentary Rocks: Compacted and Cemented Sediment

form after weathering breaks rocks down, gravity & erosional agents transport & deposit the sediment, & then sediment lithified

Most sedimentary rock is deposited by solid material settling out of a fluid

Sedimentary rocks make up:
5% of Earth’s outer 10 miles g
75% of all continental rock outcrops

Used to reconstruct details about Earth’s history

Economically important: Coal, Petroleum, Gas, Metals, Fertilizer, & Construction Materials

Classification

classified in 2 groups
Detrital from weathered solid particle (rock)
Chemical from ion in solution
biochemical considered a type of chemical, Materials precipitated by organisms
Detrital sedimentary rocks
Contain variety of minerals & rock fragments
Clay & quartz are most common
classified by particle size & then composition
Used to determin environment of deposition: Higher energy → larger particles

Sandstone (or Quartz Sandsotne)
Arkosic Sandsotne high Quartz
Arkose > 25% feldspare, so has pink color
Black Shale (organic) organic materials
Red Shale has Fe-oxides
White Shale

Characteristic properties of Shale is fissile (occur in weakness zone)
Chemical sedimentary rocks
Solid material precipitates to form sediments
Ex. salt left behind when water evaporates

biochemical sediments
Eg. shells & hard parts
Limestone is composed of calcite CaCO₃, Nearly 90% is formed by organisms

Coquina: loosely cemented shell fragments
Chalk: hard parts of microscopic organisms
Travertine: inorganic limestone, in caves
Chert, jasper, agate: microcrystalline SiO₂
Salt & gypsum: in evaporite deposits
Coal consists mostly of organic matter, found in swamps

Formation of coal
Plants buried → O, H, N in organic mater volatile so its evaporating under pressure (green color)→ beat → brown leginite → Black Petuminas (high pressure & Energy) → Anthrasite (Non sedimentary)

Lithification Process

process by which sediment is transformed into sedimentary rock, include:
1. Compaction occurs when grains are pressed closer together so that pore space is reduced
– Weight of accumulated sediment
– Most significant in fine-grained rocks
2. Cementation occurs when water containing dissolved minerals moves through pores
– Cement precipitates, fills pores, & joins particles together
– common cements: Calcite, Silica, & Fe-oxide

Characteristic of sedimentary rocks

Strata or Beds layers of sedimentary rocks
Thickness range [microscopic – tens m]
Mark the end of one episode of sedimentation & the beginning of another

Fossils Traces or remains of life
Important clues of ancient environment
Can be used to match up rocks of the same age found in different places

Metamorphic Rocks: New from Old

produced when preexisting parent rock is transformed
Parent rock: can be Igneous, Sedimentary, or Metamorphic rocks

Metamorphism

Elevated T & P, occurs if rock is subjected to a different environments, Equilibrium with new environment

Most metamorphism occurs in 2 settings:
1. Contact or thermal: Rock T increases because of intruding magma
2. Regional: P & T, during mountain building, produce most of metamorphic rocks

What causes metamorphism: occurs because parent rock is not in equilibrium

How does metamorphism affect rocks: Heat & pressure change texture, mineralogy, & sometimes chemical composition

Metamorphism can change the texture
Low-grade (Contact) compact, & denser
High-grade (Regional) recrystallization & growth of visible crystals
Metamorphism progresses incrementally
Low-grade (slight changes) to high-grade (substantial changes)

Agents of metamorphism

Heat: from intrusion of magma or burial, reactions & recrystallization of new minerals
Confining pressure (contact): equal in all directions due to burial, Compaction & recrystallization
Differential stress (regional): greater in one direction due to mountain building, Deformation & development of metamorphic textures
– Rocks can react by breaking (brittle)
– Rocks can react by bending (ductile)
– brittle Vs ductile: depending on T
Chemically active fluids: hydrothermal fluid rich in Fe, Catalyze recrystallization reactions
– Dissolve mineral from one area & precipitate it in another, & change composition of surrounding rocks
Foliation
development of a flat arrangement of mineral grains

Classification

Foliation rocks (regional)
– Driven by compressional stress 
– Causes grains to develop parallel alignment
– Includes:
1. Parallel alignment of micas
2. Parallel alignment of flattened pebbles
3. Separation of light & dark minerals
4. Development of rock cleavage

Nonfoliated rocks
– occur when deformation is minimal & parent rock is composed largely of stable minerals
Common foliated metamorphic rocks
Slate has special cleavage, From shale or ash
Phyllite larger grains than slate, which give it a glossy sheen & wavy surface
Schist formed by regional mata. of shale
Gneiss banded rock that, have intricate folds
Common nonfoliated metamorphic rocks
Marble coarse crystalline, From limestone
Quartzite very hard due to quartz grains, From metamorphosed quartz sandstone

From Slate to Gneiss (grade increase)

Summary

Foliated regional, High-grade, Differential P
Nonfoliated Contact, Low-grade, Confining P

The End

Matter & Minerals

Copyright: Foundations of Earth Science, 7th ed
Online Quiz

Minerals

Building Blocks of Rocks

mineralogy: study of minerals

Minerals: Naturally occurring, inorganic, solid with crystalline structure & defined chemical & physical properties that allow it for some variation

Naturally occurring: Form by natural geologic processes, so Synthetic materials are not considered minerals

Inorganic: Crystalline solids from organic sources are not minerals
Some organisms secrete inorganic compounds like calcium carbonate, these material considered a mineral if they become part of the rock record

Solid exception is mercury –> liquid

Crystalline structure Atoms arranged in an organized, & repetitive manner, Organization is reflected in the crystal shape

Chemical composition that allows for some variation: Most minerals are compounds so can be expressed as a chemical formula such as quartz SiO₂
– Composition vary due to substitute for elements & substituting of elements have the same size will not change the crystalline structure of the mineral

Important in human history
1. Flint & chert for weapons & tools
2. Gold, silver, & copper mined by Egyptians
3. Bronze developed by 2200 BC
4. Mining became common by Middle Ages
Crystalline structure

rocks

naturally occurring solid aggregate mass of mineral, or mineral-like matter

Most aggregates of several different minerals

Individual properties of the minerals are retained

Some rocks are composed of a single mineral, Such as limestone → calcite

Some rocks  made of non-mineral, Such as obsidian & pumice (glass), & coal (organic)

Atoms

Building Blocks of Minerals

All matter, including minerals, is composed of atoms, & All atoms (excluding H & He) formed inside massive stars by fusion

Atom: the smallest particle that cannot be chemically split
particles that make up an atoms
Atoms contain even smaller particles: Protons, Neutrons, & Electrons

Protons, Neutrons, & Electrons

Protons & neutrons have almost identical masses, & Electrons are much smaller (1/2000) than protons & neutrons

Protons +ve
Found in the nucleus
atomic number: number of P⁺ in the nucleus, & Determines chemical nature of atom
element: atom with the same atomic number

Electrons – ve
Surround the nucleus like a cloud
Valence electrons interact to form bonds
Move around the nucleus in a cloud with different regions called principle shells
Each principle shell has an energy level & a specific number of electrons
The outer shell contains valence electrons
Interact with valence electrons of other atoms to form chemical bonds

Neutrons no charge
Found in the nucleus

Most matter is neutral, because the charges of P⁺ & e- cancel each other out
e- are sometimes shown orbiting the nucleus like planets in a solar system, & actually surround the nucleus like a cloud
Approximately 90 naturally occurring elements
Elements are arranged in the periodic table
Elements with similar properties line up in columns
Most minerals are chemical compounds
2 or more elements joined together, A few minerals are made up of single elements
Native minerals

Atoms Bond

Elements (excluding noble gasses) form bonds under the T & P conditions that occur on Earth
Bonds lower the total energy of the atoms & make them more stable
The Octet Rule
Atoms tend to gain, lose, or share electrons until they have eight valence electrons

Eight valence electrons is a stable arrangement & a full valence shell

The noble gasses all have full valence shells so they lack chemical reactivity

Elements gain, lose, or share electrons during chemical reactions producing stable electron arrangements

A chemical bond

transfer or sharing of electrons that results in a full valence shell

Ionic bonds: electrons are transferred
Covalent bonds: electrons are shared
Metallic bonds: electrons move around

Ionic Bonds

Electrons Transferred

When one atom loses or gains valence electron, ions are formed
1. Electrons are lost: becomes +ve ion
2. Electrons are gained: becomes – ve ion

Ionic bond form when ions with opposite charges attracted, & Creates ionic compound

Ionic compounds have very different properties than the bonded elements that make them up
Ionic bond, found in Halite (table salt)
Na loses a valence electron (becomes +ve)
Cl gains a valence electron (becomes – ve)
Both have the same charge

Sodium: Soft, silver, toxic metal that reacts explosively when exposed to water

Chlorine: Poisonous green gas
A covalent bond forms when electrons are shared between atoms

Metallic Bonds

Electrons Free to Move

form when valence electrons are free to move from one atom to another

All atoms share available valence electrons
Movement of e- between atoms results in:
1. High electrical conductivity
2. Malleability
3. Other unique properties of metals

Physical Properties

Minerals have a definite crystalline structure & chemical composition that Gives them unique physical & chemical properties & These properties can be used in identification

Include
Luster
Ability to transmit light
Color
Streak
Crystal Shape or Habit
Strength (Tenacity, Hardness, Cleavage, Fracture)
Density & Specific Gravity
other distinctive properties (Taste, Feel, Smell, Magnetism, Optical properties, & Effervescence)

Luster

quality of light reflected from the surface of a mineral

Types of Luster
metallic: Minerals that look like shiny metal
submetallic: appears slightly dull
Nonmetallic: Vitreous or glassy, dull, earthy, pearly, silky, & greasy

Ability to transmit light

opaque: do not transmit light are
translucent: transmit light, but not image
transparent: transmit both light & images

Color

may be one of the most obvious properties of a mineral, but it is only a diagnostic property for a few minerals

Slight variations in the chemical composition can change the color dramatically
Color

Streak

is the color of a mineral in powdered form
Obtained by rubbing the sample on an unglazed porcelain tile (streak plate)
Streak, unlike color, is generally consistent
Metallic minerals have a dense, & dark streak
Nonmetallic have a light streak
Not all minerals produce a streak
Streak

Crystal shape or habit

is the characteristic shape of individual mineral crystals
Most minerals grow in one common shape, but some have 2 or more shapes
Crystal Habit
Crystal Habit

strength

determined by the strength of chemical bonds & determines how minerals break or deform under stress

Include
Tenacity, Hardness, Cleavage, Fracture

Tenacity

resistance to breaking or deforming

Minerals with ionic bonds tend to be brittle, shatter under stress

Minerals with metallic bonds are malleable, deformed into shapes & thin sheets

Sectile minerals cut into thin shavings

Elastic minerals return to its original shape after being bent

Hardness

resistance to abrasion or scratching
measured on a scale of 1 to 10 (Moh’s Scale)
Can be determined by rubbing the mineral against a material of known hardness

Cleavage

tendency of a mineral to break along planes of weak bonding
This produces smooth, & flat surfaces
Not all minerals have cleavage
Cleavage easily confused with crystal shape
cleavage is visible when a mineral is broken

Fracture

property resulting from chemical bonds that are approximately equal in strength
Irregular: uneven broken surface
Conchoidal: smooth, curved broken surface
Some minerals exhibit splintery or fibrous broken surfaces
Fracture

Density & Specific Gravity

Specific gravity describes the density
Specific gravity G: Ratio of a mineral’s weight to an equal volume of water
Most minerals have G between 2 & 3
Many of the metallic minerals have a much higher G (20 for gold)
G estimated by hefting mineral in your hand

other distinctive properties

Taste halite is salty
Feel talc is soapy, & graphite is greasy
Smell sulfur smells like rotten eggs
Magnetism some can be picked up by a magnet & some can pick up iron objects
Optical properties calcite refracts light
Effervescence carbonate minerals fizz when exposed to dilute acid HCl
Double refraction in calcite Optical properties, & Interaction with HCl for carbonaceous minerals Effervescence
Summary

Mineral Groups

There are > 4000 named minerals, but only a few are abundant in Earth’s crust known as rock-forming minerals

Economic minerals are less common than rock-forming minerals, but are used in the manufacture of products

silicate groups: Silica & oxygen combined to form the basic building block for the silicates
The most common minerals
More than 800 silicate minerals
Make up 90% of the Earth’s crust

The remaining mineral groups referred to as the nonsilicates
Far less abundant in Earth’s crust
Some are very important economic minerals
The majority of rock-forming minerals are made up of only eight elements
The silicon-oxygen tetrahedron is the building block of all silicates
Four O surround Si atom
Tetrahedra can be joined into chains, sheets, or 3D networks by sharing O atoms

Silicate Minerals

Feldspars are the most common silicates, > 50% of Earth’s crust

Quartz is second-most abundant mineral in continental crust

Only common mineral composed completely of Si & O

Silicate minerals tend to cleave between the strong silicon-oxygen structures

Most silicate minerals crystallize from molten rock as it cools

Environment & chemical composition determines which minerals are produced

Some silicate minerals form at Earth’s surface as other silicates are weathered

Some silicate minerals form at extreme pressures during mountain building
Common light silicate minerals
Feldspar, Quartz, Muscovite, Clay mineral (Contain Al, K, Ca, & Na)

Dark silicate minerals
iron, magnesium, Pyroxenes, Amphiboles, Olivine, Biotite, Garnet

Dark color & high G from iron content
Feldspars
the most abundant
In Igneous, Sedimentary & Metamorphic
Have 2 directions of cleavage at 90º
hardness = 6
K-feldspar contains K ions
Plagioclase feldspar contains Ca & Na ions, & has striated cleavage surfaces
Quartz
In Igneous, Sedimentary, & Metamorphic
Impurities cause a variety of colors
hardness = 7
Crystal Forms hexagonal + pyramid
Muscovite
member of the mica family
Excellent cleavage in one direction
hardness = 2.5
Clay minerals
the weathering product of other silicates
Common part of soil
Nearly half of the volume of sedimentary rocks is clay minerals
Olivine
major constituent of dark igneous rocks
Abundant in Earth’s upper mantle
Black to olive green, glassy luster, granular
Pyroxenes
important in dark-colored igneous rocks
Augite is black, opaque, & has 2 directions of cleavage at nearly 90º

Amphibole
group includes minerals that commonly make up dark portion of light-colored rocks
Hornblende is a dark black mineral with two cleavage planes at 60º and 120º
Biotite
is a dark, iron-rich member of the mica
Excellent cleavage in one direction
Common in light-colored rocks
Garnet
is a dark silicate
Glassy luster, no cleavage, conchoidal
Color varies, but commonly deep red
Nonsilicate minerals
divided into groups based on the – ve charged ion common to the group
Nonsilicates make up only about 8% of crust
Found in significant amount in sedimentary
Some are economically important

Carbonates
contain a carbonate ion CO₃²-
Calcite & dolomite 
Used: in road, building stone, & cement

halide
Halite is table salt

sulfate
Gypsum is used in plaster 

Halite & gypsum are common evaporites

Oxides
are important iron ores

Other economically important
Sulfides (galena, sphalerite)
Native elements (gold, silver, copper)
Fluorite
Corundum (ruby, sapphire)
Uraninite

Summary

Minerals divided into rock forming menirals that form solid earth & Valuable (economic value), Both may be Silicates or Non-silicates

Silicates (the most common) are based on the
silicon-oxygen tetrahedron, Subdivided into light & dark groups

Nonsilicates include -ve ion, common in sedimentary rocks, & Many ot them are economically important

The End

Introduction to Earth Science

Copyright: Foundations of Earth Science, Lutgans & Tarbuck, 7th or 8th edition

Geology 101

Online Quiz
Earth Science

Earth as a system

System: group of interacting, or interdependent parts, form a complex whole

Types of systems:
1. Closed system نظام مغلق
2. Open system نظام مفتوح
3. Isolated system نظام معزول

Earth is a system composed of numerous interacting parts called subsystems

The hydrosphere ,atmosphere, biosphere, & solid earth are subsystems in the whole earth system
Earth is characterized by continuous Interactions between these spheres
Shoreline: meeting place for rock,water,&air
Solid earth, or geosphere
Geosphere
Atmosphere
Hydrosphere
Resources & environmental issues
Most of Earth science may characterized as environmental science

The Nature of Scientific Inquiry

Natural world behaves in a consistent & predictable manner

SCIENTIFIC METHODS
1.Collecting data (facts) through observation & measurement
2.Constructing one or more than one preliminary, untested explanation, called scientific hypothesis
3.This hypothesis must pass objective testing & analysis
4. When hypothesis has been tested & widely accepted by scientists it elevated to a theory

Data→hypothesis→testing, analysis→theory

Paradigms

Theories that are :
extensively documented
Held with a very high degree of confidence
Comprehensive
Explain a large number of interrelated aspects of the natural world
Ex. Theory of plate tectonics

The End

Mineralogy: Crystal Chemistry

Crystal Chemistry

THE NATURE OF CHEMICAL ELEMENTS

Each Mineral composed of element in various combination

elements composed fundamental building block of matter: Proton, Neutron, & Electron

Mass of p⁺ = Mass of neutron > Mass of e- 

P⁺ & n held together in nucleus by attractive force

Atomic number (Z): Each element has specific number of p⁺ in nucleus & Z is number of Proton 

Number of n = Number of p⁺ for elements with small Atomic number, & Number of n > Number of p⁺ for elements with higher Atomic number
تتساوى اعداد النيوترونات مع البروتونات بالعناصر الخفيفة وتزداد بالعناصر الثقيلة: لان كلما زاد عدد البروتونات تزداد قوى التنافر بينها (عدم استقرار النواة) فيزداد عدد النيوترونات لتصل الذرة للاستقرار وكلما زاد عدد النيوترونات يزداد العدد الكتلي وتنتج العناصر الثقيلة “قابلة للانشطار” 

Isotope: element has different number of n

mass number : sum of number of n & p⁺

atomic mass : mass of atom divided by one-twelfth mass of ¹²C atom

Except for ¹²C atomic mass is just trifle different from mass number, Because each isotope has different number of n so each isotope must have different atomic mass

atomic weight: average weight of atomic masses of isotopes, depends on isotopic composition

Only 83 elements are available to make minerals: from 112 element in periodic table only 94 occur naturally, 11 of 94 are geologically ephemeral (occur in small amounts as short-lived radioactive isotopes produced by n-capture or radioactive decay & so it decay rapidly)
عناصر لا تدخل بتركيب المعادن (الغازات النبيلة العناصر النشطة والمصنعة بالمختبرات) والعناصر النشطة لا تدخل لان فترة وجودها صغيرة فهي تتحول لعناصر اخرى ضمن سلسلة من التفاعلات

ELECTRONS

In uncharged atom: number of e- = number of p⁺

Electron don’t orbit randomly around nucleus, but systematically organized into energy level with 4 quantum number

Pauli Exclusion Principle: no 2e- can have same of 4 quantum number
Principal Number (η)
يصف مستويات الطاقة والبعد عن النواة
have any +ve integer value

energy of e- depend on η
higher η → higher energy Because higher energy associated with greater distance from nucleus

η are correlated with shells that traditionally are identified with letters (K, L, M, N…etc)
Angular Momentum Number (l)
Depend on value of η : L = [0, (n – 1)]
distinguishes subshells with different shapes يصف شكل المدار

Calculation
maximum subshell number within shell is limited to n – 1
For K shell: l = η – 1 = 0 →(l=0) has 1s 
For L shell: l = 2 – 1 = 1 → (l=1) 2s & 2p

subshell identified with η of shell & letter of subshell
Ex. p subshell in (n=2) is 2p

magnetic quantum number (Mι)
Depend on value of l : Mι = [-l,+l]
number of orbitals within subshell = 2l + l
It distinguishes among different orbitals with different orientations within subshell
يصف اتجاه المدارات

Spin quantum number (Ms)
Each orbital contain 2e- distinguished by Ms, & the Values of Ms = +½ or ½
electron behave spinning (magnet) on axis, so Ms taken to indicate spin to right & left
each spinning charged e- behave like simple magnet with north & south pole Because magnetic field generated by movement of e-
If electron spins are balanced, so number of right & left spins is same & no net magnetic moment formed
if e- spin aren’t balanced, net magnetic moment result
range of energy levels in subshell of different shell overlap : progression of increase energy level is shown in Figure : 1s < 2s < 2p < 3s < 3p < 4s < 3d….

valence electrons

elements at right side of table (noble gasses) have all of their subshells filled 

Core: inner shell configuration, within shells are entirely filled

Valence electrons: outer shell configuration within shells that are not entirely filled

If core is identical to electron configuration of noble gas It’s called noble-gas core
Ex, Na has Ne noble-gas core + single 3s valence electron

A pseudonoble-gas core consists of noble gas core + entirely filled d & f subshell
Ex. Arsenic (As) has pseudonoble gas core 1s, 2s,2p,3s,3p,4s, & 3d subshells + three 4p valence electrons

Formation Of Ions

Ions: atoms with excess or deficiency of e- compared to number of p⁺ in nucleus

Anions: Ion with net -ve charge because have more e- than p⁺

Cations: Ion with net +Ve charge because have fewer e- than p⁺

valence or oxidation state: charge of ion

Whether element will form anion or cation can be inferred from configuration of valence electrons

Cation Vs. Anion

Metals that have noble gas or pseudonoble gas cores, have Little energy to lose valence e- to form electron configuration of noble gas, so they form cation

Nonmetals, have valence subshells that need few e- to be filled, & nonmetals have strong affinity for e- to fill outer subshell to form anion
Electronegativity (δ-)
measure propensity of element to gain or lose electrons

Elements with low δ- lose outer valence e- readily to form cations
Elements with high δ- have strong affinity for extra e- & tend to form anion

δ- values are used to estimate nature of chemical bonds
عدد التأكسد الممكن لجميع العناصر

ABUNDANCE OF THE ELEMENTS

8 element are present in substantial amounts (O, Si, Al, Fe, Ca, Na, K, & Mg) comprise large majority of crust, & are elements from which most common minerals are composed (all are cation except O)

The oceanic crust is richer in Fe & Mg (Basalt) than average crust

Determining composition of entire Earth is even more difficult because mantle & core cannot be sampled directly, & Estimates are obtained by:
1. Earth’s mass & density distribution as determined by geophysics
2. Composition of basalt derived from mantle & samples of mantle that arrive with magma
3. Composition of meteorites, represent material from which Earth accreted
4. Applying appropriate cosmological, geochemical, & petrophysical models to evaluate these data

Chemical Bonds

Chemical Bonding

Is the force that hold atoms together

grouped into 2 categories:
1. bonds involve valence electrons
2. bonds don’t involve valence electrons

Some mineral have different bond types, such as Graphite:
1. Covalent σ & π bonds
2. Intermediate covalent/metallic character
3. Van Der Waals bonds

bonds involve valence electrons (Valence Related Bonding)

involve mechanisms allow elements to acquire of noble gas or pseudo-noble- gas configuration by gain, loss, or sharing valence electron, would be in lower-energy, & form stable configuration

Types of Valence Related Bonding
1. ionic bond
2. covalent bond (sigma σ or Pi π)
3. metallic bond (conduction, valence)band

Bond Not Involving Valence Electron

depend on relatively weak electrostatic forces that can develop because of asymmetric charge distribution

These bonds are sometimes referred to as molecular or intermolecular bonds

2 mechanisms by which asymmetric charge distribution is developed are illustrated by hydrogen & Van Der Waals bonding

Types of bonds don’t involve valence e-
1. van der Waals
2. hydrogen bonding

Ionic Bond

formed by electrostatic attraction between +ve & – ve ions (Anion + Cation)

Ex. halite (NaCI) make ionic bound because:
1. Exchange of electron between Na (loss) & Cl (gains) produce stable electron configuration for both
2. Na (+ve) & Cl (-ve) have opposite charges

Nature of attractive force between oppositely charged given by Coulomb law
                         F α (q₁* q₂) / d²

Equilibrium distance between Na & Cl is given where F = 0 (At greater distances attractive force & smaller distances repulsive force is larger) F=0 → Fattractive = Frepulsive

Charges must balance Ion bonds together if net +ve charge = net -ve charge

Ionic bond fairly strong because:
1. Ion act like charged sphere & pack together in systematic & symmetrical manner
2. +ve & -ve charges alternate to form electrical neutral crystalline solid, This represent low-energy configuration

Ionic-bonded crystals tend to be brittle

Ionic crystals have strong resistance to sliding different parts past each other Because like charges repel each other

Forcing issue result in rupture rather than ductile deformation Because structures quite orderly

Failure commonly occur along cleavage plane

Covalent Bond

formed by sharing of electrons, & occurs when orbitals of 2 atoms overlap

Provided overlapping orbitals have no more than 2 electrons combined

electrons in orbital begin move about both atom because attracted to nuclei of both atom, bond established

Strength of covalent bonds is function of degree to which orbitals of adjacent atoms overlap, & more overlap yields stronger bonds (such as in diamond)

Ionic bond not possible in diamond because: 
1. all C have identical electron configuration & affinity for valence electron
2. One C cannot steal electron from another to form +ve & – ve ions

Types of covalent bond:
1. sigma (σ): has high degree of symmetry about axis parallel to length of orbitals that overlap end to end, like bond in diamond
2. pi bonds (π): orbitals overlap side to side, so e- shared laterally, found in graphite
In diamond, high degree of overlap produces very strong bond
Diamond composed of (C) & noble-gas configuration obtained by gaining or losing 4e-, & To produce covalent bond it must be share 4e-, but in ground-state configuration of C only three 2p orbitals are available, 2 have e- & third has none, & 2s orbitals cannot share nay e- because contains 2e- & To create 4 unpaired orbitals, hybrid orbitals formed:
1. One of e- in 2s promoted to vacant 2p orbital; this provides 4 unpaired orbitals
2. Because all 4 bond to adjacent C must be identical, orbital in 2s & 2p hybridized into 4 identical 3sp³ orbital 
3. Each of orbitals consists large lobe pointing in one direction & small in opposite, positioned around nucleus so that large lobes define corners on tetrahedron
4. Each of 3sp shared with identical hybrid orbital to form continuous crystal structure of diamond, Each are sigma σ covalent bonds
Bond in graphite
π & σ bonding within sheets of C is very strong, stronger than bonds in diamond, That attested by observation that C-C bonds in graphite are shorter than in diamond

low hardness of graphite is consequence of van der Waals bonds that hold sheets together

Metallic Bonds

considered to type of covalent bond in which valence electrons delocalized & free to move throughout crystal structure

Formation of metallic bonds depends on:
1. Valence electrons held weakly: like Metals that have low electronigativity
2. Number of electron shared must be large
3. Availability of vacant energy levels into which valence electrons can readily move: This is controlled by spacing between atoms

If spacing between atoms = infinite, so all atoms have same energy level & orbitals 

Width of energy band produced by subshell increases as a proximity of atoms increases

e- become free to migrate throughout structure if:
1. energy level of unfilled band overlaps that of filled band
2. outer valence subshell is only partially filled

Mg illustrates overlap of unfilled band with filled band, When Mg atoms placed in close proximity, width of energy band increase so 3s & 3p band overlap

Abundance of available energy levels allows electrons to migrate easily via structure

conduction band band has more energy level than their electrons & can conduct electrons via crystal if voltage is applied, such ad 3p band in Mg

valence band provide electrons move into conduction band, such as 3s band in Mg

inner subshells don’t contribute to electrical conduction because energy gap, known as band gap, is present between bands

Na have conduction band + valence band

Only half of energy levels in 3s band can be occupied at any one time so remaining energy levels are available for conduction

Transition metal utilize both mechanisms to produce metallic bond, conduction occur in d band (contain unfilled orbitals) & energy level of d band overlap higher s & p bands

Metalic bond no directional because metalic bond don’t involve matching specific orbital on adjacent atoms,

Metals atoms back together in highly symmetrical manner & held together by weak bonds provided by valence e- migrating throughout structure in conductiin band

Because metalic bonds are weak metals tend to be relatively soft & malleable

Because metal atoms have their valence requirements satisfied by sea of valence e-, it very easy for one metal atom to substitute for another in crystal structure

Width of energy bands increases as atoms are brought closer together

Hydrogen Bonding

Ice is most familiar mineral have H-bond

Ice composed of H₂O, Bonding occurs because H₂O polar molecule, 2H covalently bond to O by sharing electrons

Polar: Because O has high electronigativity than H, it places greater claim on shared electrons than do H & This produces electrical polarity to water molecule
Water molecule

Van Der Waals Bonds

Depend on asymmetrical charge distribution, but asymmetry is produced in different way

Van der Waals bonds are quite weak, & mineral have them (graphite & talc) are soft & greasy

soft & greasy properties used to advantage: 
1. graphite soft & black, used to make pencil, with which sheets slide past each other
2. Talc used as body powder because it is soft & helps prevent chafing of tender skin
3. Weakness found in clay minerals also leads to major engineering problem, known as swelling soil
In Graphite that consist sheet of C covalently σ & π bonded
more -ve charged electron on one side than other producing polarization, & polarization on one sheet are similar in its neighborse, & Van Der Waals pond produced by weak electrostatic atraction between opposite charge of poth sheets

Relation among Valence-Dependent Bond

values of electronegativity can be used to estimate the nature of chemical bond
1. Ionic bonding should be expected if δ- is quite different
2. Covalent & Metallic involve sharing of e- among atoms with similar affinity for e- & small or zero difference in δ-

Crystals with ionic & covalent bond have low electrical conductivity because:
1. Valenc e- held tightly in specific orbital
2. Electrical conductivity increases if crystals heated because thermal energy increases 

Crystals with metallic bonds have high electrical conductivity because:
1. Electron are free to migrate throughout structure in conduction bands
2. Electrical conductivity of metallic bonds decreases as temperature increases because greater thermal vibrational energy of lattice tends to impede migration of electron
mathematical relationship is Percent ionic character

Figure show: Empirical relationship between difference in δ- & degree of ionic character produced
Native elements, like diamond C, graphite C, sulfur S, gold Au, & silver Ag, form bonds in Δδ- = zero, These bond are intermediate between covalent & metallic

Sulfate → covalent + metallic

Silicate → covalent + ionic

Cation Vs Anion

About atoms!

Volume occupied by proton, neutron, & electron that comprise isolated atom or ion defined by probability of finding electrons at specific locations around nucleus

Probability aren’t spherical, except electron in s shells, & don’t have defined boundaries

Some probability, always exists of finding electron at great distance from nucleus

Chemical bond involve some degree of covalent bonding in which orbital from atoms or ions are inferred to overlap, to allow sharing electrons

Effective radius

Atom behave as little sphere, It convenient to define sizes of atoms in term of effective radius based on distance between centers of atoms

Effective radius of atom or ion: is size it would have if it behaved like small hard sphere

Atomic radius: effective radius of uncharged atom

Ionic radius: effective radius of anion or cation

In covalent or metallic bond bond length (L) is equal to 2 effective radius 2R
                                     L = 2R

– Techniques of X-ray diffraction used to measure bond length & sum of effective radius of atoms

– There are 2 sets of data depending on nature of chemical bonds involved:
1. For metals & semimetals, radii based on metallic bonding in structures in which atoms closely packed so that each atom is in contact with 12 other atoms
2. For non-metals, radii based on single covalent bonds

In ionic-bond, length between anion & cation = to sum of effective ionic radii of cation Rc & anion Ra
                             L = Rc + Ra

Techniques of X-ray measurement length between anions & cations but cannot tell us how much of bond length to allot to cation & how much to anion

to estimate of effective ionic radii of anions & cations:
1. Comparing different structure
2. Evaluate cation-anion & anion-anion distance

principal variables influence effective ionic radius:
1. Oxidation state (valence) of ion
2. Coordination Number (CN): Number of anions in contact with cation
3. spin state: factor in transition metals with d orbitals

Oxidation State & Coordination Number

Cations are smaller than uncharged atom Increase +ve charge produce smaller ion (size decreases) because electron held more tightly& closely to nucleus

Anions are larger than uncharged atom because nucleus is less able to hold additional electrons tightly

Interatomic distances, & effective ionic radii, influenced by number of anions contact with cation (CN)

Anions larger than cations, so structure considered to consist framework of packed anions with smaller cation tucked into interstice, or hole between anions

size of interstice determine by coordination number (CN)

large hole require more anion to define boundaries

coordination number of 4 -for example- involves 4 anion arranged at corners of tetrahedron with small space in middle in which small cation may reside

as coordination number increases, effective ionic radius of cations occupying hole defined by anions

cations expand or shrink to fill space available between anions
High spin state ions have minimum pairing of electrons in d orbitals; & low have maximum pairing & smaller

high spin state is preferred because having unpaired electrons represents lower energy configuration than having paired electrons within d orbital

some bonding geometries require hybridization that favors low-spin configuration

Iron exhibits different spin states
Under crustal conditions, high-spin configuration dominates in most minerals

The End

Mineralogy: Crystallography

Copyright: INTRODUCTION TO MINERALOGY, WIILIAM D. NESSE, 2nd Edition

Crystallography

Crystallography

Crystallography: describe shape, symmetry, & crystal structure of minerals

Tools used to described Crystals:
1. X-ray
2. petrographic microscopes
3. scanning electron microscopes

Symmetry “in general”

Types of Symmetry
1. Translational Symmetry (in 2D & 3D)
2. point Symmetry
3. space groups

The most important concepts:
1. Translational: unit cell, unit mesh, plane lattice, space lattice, crystal axes, crystal systems, Bravais lattice
2. point: reflection, rotation, inversion, 32 point groups or crystal class
3. space groups: combine translational symmetry with point symmetry operations to produce glide & screw symmetry

Nomenclature of Crystals

Crystal faces: have rational orientations relative to crystal lattices

Miller indices: described & identified individual crystal face or crystallographic plane (Ex. cleavage)

crystallographic directions & zones

crystal forms: described collection of faces of crystal, groups of face, flat, & characteristic shape

crystal habit: general characteristic external shape of crystals
Dimensions
a : thickness
b : width
c : height or length

Angle
α : the angle between c & b axis
β : the angle between c & a axis
γ : the angle between b & a axis

+a = front, -a = back
+b = right, -b = left
+c = up, -c = down,

2D Translational Symmetry

Important concepts

node: center of each spot at intersection of lattice line

unit meshes: fundamentally different shapes produced by translation nodes parallel to a & b
– there are 4 unit meshes: Square, Rectangle, Rhombus, & Parallelogram

plane lattice: continuous repeating pattern of dots produced by translation parallel to a & b
– there are 5 plane lattices can be produced by translation in 2D: Square, Rectangle, Diamond, Hexagonal, & Oblique plane lattices
“الفكرة” اي نقطة في الشكل نسميها (نود) وهذه النود تتحرك في بعدين وهم محورين أ و ب وحركتها هذه تصنع اشكال
افهم الفكرة لتستمر بفهم القادم very easy
حركة النود تصنع
5 plane lattice with 4 unit meshes
لان هناك شكلين سيشتركون بوحدة واحدة

شرح الشكل الاول:
انتقال النقطة بمسافة متساوية بين محورين أ و ب بزاوية ٩٠° سيصنع مربع 🙂 “وهكذا باقي الاشكال” ما يعني بالشكل الاول
a = b, γ = 90°
سؤال ذكي 🙂 : اين المحور الثالث؟؟ نحن الى هذه اللحظة نعمل في بعدين ما يعني محورين فقط وزاوية واحدة بينهما ودخول محور ثالث ستزيد عدد الزواية الى 3 وعدد المحاور 3 وهو الانتقال في 3 ابعاد “الموضوع القادم”

المطلوب:
فهم كل شكل من الاشكال الخمسة كيف تم اشتقاقهم بمعرفة طول كل من الضلعين والزاوية بينهما واسم الشكل واسم وحدته وهو ملخص بالصورة بالاعلى
very easy ❤

ملاحظة: الزواية التي تحتوي على جيب الزاوية او متممتها غير مطلوب اشتقاقها
ملاحظة: ممكن يجي جدول بالامتحان فارغ ويُطلب منك تعبئته بالزاوية والابعاد والاسماء واسماء الوحدات

node

node occur at corner, but diamond has centered (C) unit mesh
شرح: النقاط دائما تكون على الاطراف الا في
centared rectangle (diamond)
وهذا ما يفسر ارتباط شكلين في وحدة واحدة وهم
diamond & premative rectangle (rectangle)
وهذا بسبب طريقة اشتقاقهما، ونلاحظ من الشكل بالاعلى انه لهما نفس الابعاد والزاوية

Unit mesh axes : parallel to edges of unit mesh labeled a & b if they have same length “θ = y”, such as in reactangle & diamond
Ceramic Example
a. Square ceramic tile laid in square lattice

b. Rectangular bricks laid in rectangular lattice

c. Rectangular brick laid in diamond lattice, unit mesh includes pieces make 2 bricks

d. Hexagonal ceramic tile laid in hexagonal lattice, rhombic unit mesh includes pieces make one tile

Summary of dimensions & angles

Square: a = b, γ = 90°, Square unit mesh

Rectangle (or P-Rectangle): a ≠ b, γ = 90°, Premative (P) Rectangle unit mesh

Diamond (or C-Rectangle): a ≠ b’, γ = 90°, Centred (C) Rectangle unit mesh

Hexagonal : a = b, γ =120°, Rhombus

Oblique: a ≠ b’, γ)≠ 90°, Parallelogram

2D Translational Symmetry

Important concepts

Space lattice: 2D plane lattices systematically repeated one above other to allow for translation vector in 3D, & lattice nodes are repeated in all 3 direction

unit cell: volume outlined by lattice nodes

شرح
Space lattice ما يعني ان
هو انتقال النود (ال5 اشكال) في بعد ثالث
تخيل مربع انمط للاعلى مثلا رح ينتج مكعب، وهكذا (يعني بنمد المساحة لانتاج الحجم)

الوحدات
plane lattice → unit mesh
space lattice → unit cell

edges of unit cells identified (a,b, & c) which intersect at point called origin

Bravais Lattices: 14 different space lattices produced from repeated 5 plane lattices in 3D, & divided into 6 crystal system based on shape of unit cell (triclinic, monoclinic, orthorhombic, hexagonal, tetragonal, & isometric)

Primitive (P): unit cells contain lattice nodes only at the corners

Body-centered (I): unit cells contain an additional lattice node at the center

Face-centered (C): unit cells contain lattice nodes on the corners & on 2 opposite sides

Face-centered (F): unit cells contain lattice nodes at the corners & at the center of each face

Except for triclinic, each crystal system has more than one Bravais lattice (Important for exam)
عند انتقال
Oblique plane lattice
مسافة للاعلى ليس بزاوية ٩٠° مع كل من المحورين الاصليين ينتج
Primitive Triclinic
وهذه المجموعة لا يمكن ان تحتوي نود بالوسط لذا دائما
Primitive Triclinic
الابعاد والزواية والشكل وطريقة تكونه بخانة “ملاحظة” مهم

والاشكال القادمة نفس الشيء هو مجرد انتقال للاشكال التي صنعناها بالبعدين في بعد ثالث

Copyright: Shaas 🙂

Notes

different between face-centered in how crystal axes labeled, in orthorhombic isn’t done consistently

اكثرهم تنوعاً Orthorhombic

افضل برنامج لفهم الموضوع
MT.aps Crystal Viewer

Point Symmetry

Point Symmetry

Point symmetry: how a motif repeated about point

Motif: may be crystal face or particular arrangement of atoms mack up crystal structure

possible point symmetry operations are:
1. reflection (m)
2. rotation (A)
3. inversion (i)
rotoinversion: Rotation combined with inversion to produce symmetry called (1, 2, 3, 4, or 6)-fold rotoinversion axes

Point about which symmetry are recognized center of crystal or origin of unit cell
Reflection (m)
produced by mirror plane (m) that passes through crystal structure so the pattern on one side is mirror image of pattern on the other

Only planes in specific orientations can be mirror planes

Monoclinic →1m
Triclinic → no mirrors
Isometric → 9 m or less
Rotational (A)
symmetry involves repeating a motif by set of uniform rotations about an axis
A₂ →every 180°
A₃ →every 120°
A₄ →every 90°
A₆ → every 60°
Inversion (i)
center of symmetry, point (corner) have equivalent point in opposite side
في الشكل: الشكل الاول يوجد به انعكاس اما الثاني لا
Compound Symmetry Operation (Rotoinversion)

À₁: Simplest, produced by (A₂) 360° + i, & can be duplicated

À₂ produced by (2A₂) 180° + i + m, & can be duplicated

À₃ produced by (A₃) 120° + i, & can be duplicated

À₄ cannot be duplicated, 90° rotation followed by i

À₆ produces same result as A₃ at right angles to mirror (A₃ at 60° + m)

شرح: مثلا اذا عملت تدوير لشكل بمقدار 360° ولم يتكرر الوجه ثم كان ممكن تعمل انعكاس يكون يحتوي
1-fold rotoinversion or À₁
وهكذا…

Symmetry Notation

symmetry symbols refer to symmetry operations
هناك طريقتين للتعبير عن الرموز
بالشكل ٣ محاور دورانية ثنائية وانعكاس و٣ مُري
ونستطيع التعبير عنه كالاتي
1. 3A₂, 3m, i
2. Herman-Mauguin: 2/m,2/m,2/m
/ = Perpendicular
2 = A₂
Frequency of 2/m = number of A₂

اهملنا الانعكاس لانه يوجد دوران ويوجد مرآة وبالتالي ضمنيا يوجد انعكاس

ملاحظات مهمة بما يخص
Rotoinversion
À₁ = i
لانه فعليا التدوير 360° هو العودة لنفس النقطة وبالتالي هو انعكاس عادي لذا يمكننا الاستعاضة عن هذا الرمز واستبداله برمز الانعكاس مباشرة
À₂ = m
يمكن استبدال هذا الرمز برمز المراي لانه فعليا مجرد انعكاس
À₃ = A₃ + i
À₆ = A₃ + m

To Determining Crystal System & Crystal Class

Determine center of symmetry
Identify any mirror planes
then Identify rotation axes & rotoinversion

افضل برنامج لفهم الموضوع
Crystal Form Lite

The 32 Point Groups or crystal classes

Symmetry elements of i, A, & m combined in variety of ways, but combinations are limited because symmetry elements must be compatible with each other
In 2D possible symmetry elements are m & A, that may be taken individually or combined to produce l0 different 2D point group
In 3D symmetry elements are i, m, A, so number of different combination of symmetry increases to 32 (32 point group or crystal class)

Point groups grouped into 6 crystal systems based on common symmetry elements

6 crystal system defined based on unit cell geometry that generated from Bravais lattice

Table shows symmetry elements possessed by crystal classes & crystal system
الجدول مهم

Notes

point group for each crystal system can be use any Bravais lattice from that crystal system, but Single exception occurs in hexagonal system where only trigonal division use Rrhombohedral Bravais lattice

اكثرهم تماثل Isometric
the most common system in the nature is monoclinic then orthorhombic
The least common system in nature is hexagonal then tetragonal

Calcite → Trigonal (Not rare)

hexagonal & trigonal (crystal family)

Space Group

produced by point group + space lattice

There are 230 space groups represent all combinations of point symmetry with translational symmetry

point group symmetry must be consistent with symmetry of lattice, for Ex. Isometric point groups used only with isometric lattices, tetragonal with tetragonal lattices… atc

These combinations yield 73 space groups, so there are 2 additional symmetry operations called glides & screws are possible in 3D, Each is compound symmetry operation

Glide: translation + reflection across mirror (glide) plane
Ex. Chain silicate (in pyroxene)

Screw: produced by translation + rotation

Crystal Faces

Crystal faces always grow in rational orientations relative to the crystal lattice

most common faces are parallel to surfaces of unit cell, that parallel to principal planes via crystal lattice

Result with cubic unit cell is cubic crystal, hexagonal unit cell have hexagonal cross section… atc

Tendency of crystal faces to follow simple, rational orientation through crystal lattice has resulted in recognition of 2 related laws of crystallography:
1. Law of Hauy : Crystal faces make simple rational intercepts on crystal axes
2. Law of Bravais : Common crystal faces parallel to lattice plane that have high lattice-node density

• كلما كانت النود “الكثافة” اكثر تزداد فرصة نمو البلورات
• اكثر الاوجه شيوعا اكبرها مساحة وموازية لوحدة الخلية
• اقل البلورات مساحة هي اقل نمو بلورات واقل كثافة
Figure shows P-monoclinic lattice with several potential crystal faces

Planes A, B, & C principal planes in lattice, have high lattice-node density, parallel to faces of unit cell, & it likely crystal faces

Plane T: fairly density & likely crystal face

Plane Q: low density & not likely crystal face

Miller Indices

Because crystal face have rational orientation relative to crystal lattice, it possible to develop short-hand system to describe orientation of crystal faces & crystallographic planes

Miller index: short-hand system describe orientation of crystal faces & crystallographic plane, consist of series of coprime integer that are inversely proportional to intercepts of crystal face or crystallographic plane with edges of unit cell

Miller index has general form hkl, where h, k, & l = a, b, & c crystal axes Respectively
– (hkl) = phase
– [hkl] = vector
– (001) read zero zero one
– (112): read one one two

Negative values indicated with bar over top of number
– (IT0) read one bar-one zero or one negative-one zero

Because values in Miller index coprime integers, values like (224) arn’t used because all integers divisible by 2, so = (112)
Consider monoclinic mineral that forms crystal with face t, if extended to intersects all 3 crystal axes (Figure a), This face cuts via lattice (Figure b) so that numbers of unit cells out from crystal center on a & b = 2c, Miller index for face t is inverse of these values, then:
(12 12 6) = (1 1 ½) = (1 1 ½)-¹ = (1 1 2) = (hkl)
This means: face cuts cell at 1 unit along a & b, & half unit cell along c
حاول تفهم الي عملو بكل فيس حلو الموضوع ومش كثير صعب
Indices & Crystal Axes in Hexagonal System

Crystal axes & indices in hexagonal require some additional explanation because 2 conventions use (a, b, c), & (a₁, a₂, a₃, & c)

Consider (a, b, c) crystal axes located according to 3-axis convention

Consider (a₁, a₂, a₃, & c) 4 axes, Miller-Bravais index contains 4 integers (hkil)

دائماً يكون
h + k + i = 0

للحويل بين النظامين فقط قم بحذف
i

Mathematically: Determine Miller Index: require 2 piece of data

1. Axial intercepts for crystal face (i)
2. unit cell dimension or axial ratio (a:b:c)
هي اطوال المحاور
تقسم جميع الاطوال على الطول الاوسط (ب)
بحال اعطاك السؤال نسبة جاهزة لا تقسم “بدون وحدة”
اذا حصلت على النسبة، والتقاطع تستطيع الحساب بقسمة النسبة على التقاطع
او العكس “مع اخذ المقلوب”
Calculating the Miller index of x face if the unit cell dimensions are a = 9.73 A°, b = 8.91A°, & c = 5.25 A°
اولا نحسب النسبة “القانون الاول”
a : b : c = 9.73/8.91 : 8.91/8.91 : 5.25/8.91
a : b : c = 1.09 : 1 : 0.59
ثانيا نقسم النسبة على التقاطع “القانون الثاني”
(hkl) α (1.09/3.82) (1/3.5) (0.59/2.07)
(hkl) α (0.28 0.28 0.29)
So. (hkl) α (1 1 1)

Zones

Zone

collection of crystal faces all of which are parallel to common line called zone axis

Zone identified with index of zone axis [uvw]

For example, tetragonal prism constitutes zone because faces parallel to common line (c axis) through middle of prism, zone axis is there fore 001

zone axis also is parallel to edges defined by intersection of the faces

Crystal Forms

crystal forms

collection of equivalent crystal faces that are related to each other by symmetry of the mineral

A form may be either:
1. open form O: doesn’t entirely enclose volume
2. closed form C: entirely encloses volume
Each crystal form identified by braces { } around hkl Miller index of one of the faces that comprise the form

{011} identifies 4 faces equivalent to (011)
{100} identifies 2 faces equivalent to (100)
Isometric Forms
15 different forms, all of them are closed, is possible in the isometric system

most common are
– cube {001}
– octahedron{111}
– tetrahedron{111}
– rhombic dodecahedron{110}

Nonisometric Forms (disphenoid)

The no isometric forms are also known as disphenoid

possible in tetragonal, hexagonal, orthorhombic, monoclinic, & triclinic

consist of :
1. PEDION or MONOHEDRON (O): single face with no geometrically equivalent face elsewhere on crystal, No symmetry element repeats the face

2. PINACOID or PARALLELHEDRON (O): 2 parallel faces on opposite sides related by i or m

3. DIHEDRON (O): 2 nonparallel faces
A. DOME related by m
B. SPHENOID related by A₂

4. PRISM (O): 3,4,6,8, or 12 face intersect in set of mutually parallel edge forming tube named based on shape of cross section & Faces that close ends of prism aren’t part of form

5. PYRAMID (O): 3, 4, 6, 8, or 12 non-parallel face intersect at point, named based on cross section, may be either top or bottom

6. DIPYRAMID (C): 2 pyramid related by reflection, with 6, 8, 12, 16, or 24 faces

7. TRAPEZOHEDRON (C): 6, 8, or 12 trapezoid faces, faces on one end offset relative to faces on other, for Ex. Tetragonal trapezohedron have 8 faces, 4 on top & 4 on bottom

8. SCALENOHEDRONS (C): 8 or 12 scalene triangle faces, faces appear to be arranged in pairs

9. RHOMBOHEDRONS (C): 6 rhomb faces, looks like cube that stretched from corner to corner

10. TETRAHEDRONS (C): 4 triangular faces:
A. ln tetragonal system (tetragonal tetrahedron): 4 faces are identical isosceles triangles
B. ln orthorhombic system (rhombic tetrahedron): face form 2 pair different isosceles triangle

Combining Crystal Forms

Simple crystals may consist of only single closed form such as cube or dipyramid; more complex crystals may include several different open and/or closed forms

All forms on any given crystal must be compatible with one another: mineral crystallizes in isometric system include isometric forms…atc

mineral can have only forms that consistent with symmetry of crystal class to which it belongs
Ex. pinacoid isn’t composed of 2 pedion but 2 parallel face related by symmetry
cube consists of six equivalent faces; it is not composed of three pinacoid

Forms that occur in 32 point group (crystal class) within 6 crystal systems limited by symmetry of point group
Ex. tetragonal prism have single A4 they found only in tetragonal point groups that have single A4

CRYSTAL HABIT

Minerals may or may not display crystal faces depending on conditions of growth
A. Euhedral: display well-formed faces
B. Subhedral: crystal faces are present, but are not well-formed
C. Anhedral: without crystal faces
مهم
range of terminology used to describe relative dimensions of individual crystals or grains
Patterns of mineral growth
a. Elongate: form parallel, radiating, or felted masses
b. Platy or micaceous: form foliated or plumose arrangements
c. Equant: form fine-to coarse-grained granular masses

The End